5 Essential pandas Tricks for Data Science 🐼 #pandas #Python #DataScience #MachineLearning #Analyti
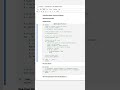
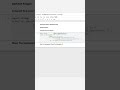
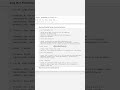
1. Create a DataFrame from a Python dictionary
Building a DataFrame from a dict lets you convert in-memory data structures into tabular form for analysis.
# Long form
import pandas as pd
data = {
'Name': ['Alice', 'Bob', 'Charlie'],
'Age': [25, 30, 35],
'Score': [85.5, 92.0, 88.0]
}
df = pd.DataFrame(data)
# One-liner
df = __import__('pandas').DataFrame({'Name':['Alice','Bob','Charlie'],'Age':[25,30,35],'Score':[85.5,92.0,88.0]})
This yields a DataFrame with columns Name, Age, and Score for each record. The one-liner uses __import__('pandas') to collapse code for quick snippets.
2. Select specific columns from a DataFrame
Extracting just the columns you need keeps downstream operations focused and fast.
# Long form
selected = df[['Name', 'Score']]
# One-liner
selected = __import__('pandas').DataFrame(data)[['Name','Score']]
Here, selected holds only the Name and Score columns. Using df[['col1','col2']] returns a new DataFrame with those fields.
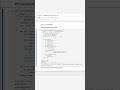
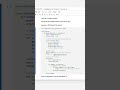
3. Filter rows based on a condition
Boolean indexing on DataFrames lets you slice rows meeting criteria without explicit loops.
# Long form
mask = df['Age'] v 28
filtered_df = df[mask]
# One-liner
filtered_df = __import__('pandas').DataFrame(data)[__import__('pandas').DataFrame(data)['Age']v28]
This produces only rows where Age exceeds 28 (Bob and Charlie). The mask df['Age'] v 28 yields a boolean Series used to index the DataFrame.
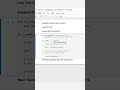
4. Group by a column and compute aggregates
Grouping followed by aggregation summarizes data by categories—essential for reporting and feature engineering.
# Long form
grouped = df.groupby('Name').agg({'Score': ['mean', 'max']})
# One-liner
grouped = __import__('pandas').DataFrame(data).groupby('Name').agg({'Score':['mean','max']})
The result is a hierarchical-index DataFrame showing each person’s average and maximum Score. Use .agg() to apply multiple functions at once.
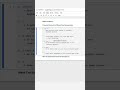
5. Merge (join) two DataFrames
Merging lets you combine disparate tables by key columns—like SQL JOINs—to enrich your dataset.
# Long form
left = pd.DataFrame({'ID': [1,2,3], 'City': ['NY','LA','SF']})
right = pd.DataFrame({'ID': [2,3,4], 'Salary': [70000, 80000, 90000]})
merged = pd.merge(left, right, on='ID', how='inner')
# One-liner
merged = __import__('pandas').merge(
__import__('pandas').DataFrame({'ID':[1,2,3],'City':['NY','LA','SF']}),
__import__('pandas').DataFrame({'ID':[2,3,4],'Salary':[70000,80000,90000]}),
on='ID', how='inner'
)
merged contains only IDs present in both tables (2 and 3), with their City and Salary. Change how to 'left', 'right', or 'outer' for different join behaviors.
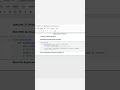
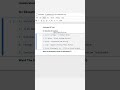
5 Interview Questions (with Answers):
1. Q: What is the difference between a pandas Series and a DataFrame?
A: A Series is a one-dimensional labeled array; a DataFrame is two-dimensional, with rows and columns, essentially a dict of Series sharing an index.
2. Q: How do you handle missing values in pandas?
A: Use methods like df.dropna(), df.fillna(value), or interpolation functions (df.interpolate()) to remove or impute nulls.
3. Q: What’s the difference between merge() and join()?
A: merge() is a function allowing SQL-style merges on arbitrary columns; DataFrame.join() is a method that by default joins on the index.
4. Q: How would you pivot a DataFrame from long to wide format?
A: Use df.pivot(index='row_key', columns='col_key', values='value_col') or df.pivot_table(...) for aggregation.
5. Q: What is method chaining in pandas, and why use it?
A: Method chaining strings multiple operations together (e.g., df.dropna().groupby(...).sum()), improving readability and avoiding intermediate variables.
#pandas #Python #DataScience #CodingTips #DataWrangling #Analytics #DeveloperShortcuts
Видео 5 Essential pandas Tricks for Data Science 🐼 #pandas #Python #DataScience #MachineLearning #Analyti канала CodeVisium
Building a DataFrame from a dict lets you convert in-memory data structures into tabular form for analysis.
# Long form
import pandas as pd
data = {
'Name': ['Alice', 'Bob', 'Charlie'],
'Age': [25, 30, 35],
'Score': [85.5, 92.0, 88.0]
}
df = pd.DataFrame(data)
# One-liner
df = __import__('pandas').DataFrame({'Name':['Alice','Bob','Charlie'],'Age':[25,30,35],'Score':[85.5,92.0,88.0]})
This yields a DataFrame with columns Name, Age, and Score for each record. The one-liner uses __import__('pandas') to collapse code for quick snippets.
2. Select specific columns from a DataFrame
Extracting just the columns you need keeps downstream operations focused and fast.
# Long form
selected = df[['Name', 'Score']]
# One-liner
selected = __import__('pandas').DataFrame(data)[['Name','Score']]
Here, selected holds only the Name and Score columns. Using df[['col1','col2']] returns a new DataFrame with those fields.
3. Filter rows based on a condition
Boolean indexing on DataFrames lets you slice rows meeting criteria without explicit loops.
# Long form
mask = df['Age'] v 28
filtered_df = df[mask]
# One-liner
filtered_df = __import__('pandas').DataFrame(data)[__import__('pandas').DataFrame(data)['Age']v28]
This produces only rows where Age exceeds 28 (Bob and Charlie). The mask df['Age'] v 28 yields a boolean Series used to index the DataFrame.
4. Group by a column and compute aggregates
Grouping followed by aggregation summarizes data by categories—essential for reporting and feature engineering.
# Long form
grouped = df.groupby('Name').agg({'Score': ['mean', 'max']})
# One-liner
grouped = __import__('pandas').DataFrame(data).groupby('Name').agg({'Score':['mean','max']})
The result is a hierarchical-index DataFrame showing each person’s average and maximum Score. Use .agg() to apply multiple functions at once.
5. Merge (join) two DataFrames
Merging lets you combine disparate tables by key columns—like SQL JOINs—to enrich your dataset.
# Long form
left = pd.DataFrame({'ID': [1,2,3], 'City': ['NY','LA','SF']})
right = pd.DataFrame({'ID': [2,3,4], 'Salary': [70000, 80000, 90000]})
merged = pd.merge(left, right, on='ID', how='inner')
# One-liner
merged = __import__('pandas').merge(
__import__('pandas').DataFrame({'ID':[1,2,3],'City':['NY','LA','SF']}),
__import__('pandas').DataFrame({'ID':[2,3,4],'Salary':[70000,80000,90000]}),
on='ID', how='inner'
)
merged contains only IDs present in both tables (2 and 3), with their City and Salary. Change how to 'left', 'right', or 'outer' for different join behaviors.
5 Interview Questions (with Answers):
1. Q: What is the difference between a pandas Series and a DataFrame?
A: A Series is a one-dimensional labeled array; a DataFrame is two-dimensional, with rows and columns, essentially a dict of Series sharing an index.
2. Q: How do you handle missing values in pandas?
A: Use methods like df.dropna(), df.fillna(value), or interpolation functions (df.interpolate()) to remove or impute nulls.
3. Q: What’s the difference between merge() and join()?
A: merge() is a function allowing SQL-style merges on arbitrary columns; DataFrame.join() is a method that by default joins on the index.
4. Q: How would you pivot a DataFrame from long to wide format?
A: Use df.pivot(index='row_key', columns='col_key', values='value_col') or df.pivot_table(...) for aggregation.
5. Q: What is method chaining in pandas, and why use it?
A: Method chaining strings multiple operations together (e.g., df.dropna().groupby(...).sum()), improving readability and avoiding intermediate variables.
#pandas #Python #DataScience #CodingTips #DataWrangling #Analytics #DeveloperShortcuts
Видео 5 Essential pandas Tricks for Data Science 🐼 #pandas #Python #DataScience #MachineLearning #Analyti канала CodeVisium
Комментарии отсутствуют
Информация о видео
Вчера, 8:57:28
00:00:10
Другие видео канала