- Популярные видео
- Авто
- Видео-блоги
- ДТП, аварии
- Для маленьких
- Еда, напитки
- Животные
- Закон и право
- Знаменитости
- Игры
- Искусство
- Комедии
- Красота, мода
- Кулинария, рецепты
- Люди
- Мото
- Музыка
- Мультфильмы
- Наука, технологии
- Новости
- Образование
- Политика
- Праздники
- Приколы
- Природа
- Происшествия
- Путешествия
- Развлечения
- Ржач
- Семья
- Сериалы
- Спорт
- Стиль жизни
- ТВ передачи
- Танцы
- Технологии
- Товары
- Ужасы
- Фильмы
- Шоу-бизнес
- Юмор
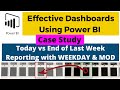
QT#70- Neat Idea For Adding Conditional Formatting Alternative to DATA BARS in Power BI TABLE VISUAL
In this short video, I'll explain my solution to add conditional formatting to data bars on a table visual in Power BI.
The standard functionality in a Power BI table visual allows you to add a data bar that represents the relative value displayed in the table cell. You can select the colour of the bar, but can't link this colour to a condition (with the expectation of choosing a different colour for negative and positive values).
In this solution, I explain how to add a red dot indicator next to the bar to indicate values that are outwith a given target threshold. This allows you to quickly draw the viewer's attention to the value that they need to investigate.
----------------------------------
⏩ Video Navigation
----------------------------------
00:00 - Introduction
00:50 - Why NOT to use coloured text labels
01:38 - Creating a red dot measure
02:18 - Adding the red dot to the table
03:00 - Adding the target text
-----------------------------------------------------
🎥 Related Videos
-----------------------------------------------------
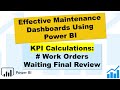
Maintenance KPI - Percentage of Proactive and Reactive Work Hours Completed
https://youtu.be/zy8iARdCyOE
(video explaining how to build the dashboard used in this video)
-----------------------------------------------------
🎓 Power BI Dashboard Training
-----------------------------------------------------
👉FREE Power BI Quick Start Course - Learn how to create your first dashboard in around 90 minutes!
https://effectivedashboards.com/power-bi-quick-start-create-a-pbi-dashboard-in-90-minutes/
👉 Power BI Quick Start PLUS - Learn how to craft KPI management dashboards that really do help you, your boss, and your peers make better decisions!
https://effectivedashboards.com/power-bi-quick-start-plus/
-------------------------
📁 Resources
-------------------------
👉Access to the source PBIX files for my YouTube videos:
https://effectivedashboards.com/course/qt70-neat-idea-for-adding-conditional-formatting-alternative-to-data-bars-in-power-bi-table-visual/
👉Article series on creating a maintenance management system data model and how to address the human factors of data collection for improved data quality. (This is not just relevant to maintenance and reliability data).
https://effectivedashboards.com/data-articles/
Видео QT#70- Neat Idea For Adding Conditional Formatting Alternative to DATA BARS in Power BI TABLE VISUAL канала Jason Davidson (Power BI)
The standard functionality in a Power BI table visual allows you to add a data bar that represents the relative value displayed in the table cell. You can select the colour of the bar, but can't link this colour to a condition (with the expectation of choosing a different colour for negative and positive values).
In this solution, I explain how to add a red dot indicator next to the bar to indicate values that are outwith a given target threshold. This allows you to quickly draw the viewer's attention to the value that they need to investigate.
----------------------------------
⏩ Video Navigation
----------------------------------
00:00 - Introduction
00:50 - Why NOT to use coloured text labels
01:38 - Creating a red dot measure
02:18 - Adding the red dot to the table
03:00 - Adding the target text
-----------------------------------------------------
🎥 Related Videos
-----------------------------------------------------
Maintenance KPI - Percentage of Proactive and Reactive Work Hours Completed
https://youtu.be/zy8iARdCyOE
(video explaining how to build the dashboard used in this video)
-----------------------------------------------------
🎓 Power BI Dashboard Training
-----------------------------------------------------
👉FREE Power BI Quick Start Course - Learn how to create your first dashboard in around 90 minutes!
https://effectivedashboards.com/power-bi-quick-start-create-a-pbi-dashboard-in-90-minutes/
👉 Power BI Quick Start PLUS - Learn how to craft KPI management dashboards that really do help you, your boss, and your peers make better decisions!
https://effectivedashboards.com/power-bi-quick-start-plus/
-------------------------
📁 Resources
-------------------------
👉Access to the source PBIX files for my YouTube videos:
https://effectivedashboards.com/course/qt70-neat-idea-for-adding-conditional-formatting-alternative-to-data-bars-in-power-bi-table-visual/
👉Article series on creating a maintenance management system data model and how to address the human factors of data collection for improved data quality. (This is not just relevant to maintenance and reliability data).
https://effectivedashboards.com/data-articles/
Видео QT#70- Neat Idea For Adding Conditional Formatting Alternative to DATA BARS in Power BI TABLE VISUAL канала Jason Davidson (Power BI)
Комментарии отсутствуют
Информация о видео
25 августа 2022 г. 22:54:35
00:04:06
Другие видео канала