Microsoft Power BI for Beginners - 2 Hour Power BI Crash Course!
In this Introduction to Power BI, we teach you 5 of the important Power BI Parts namely Power Query, Data Modelling, DAX Expressions, Reporting Features, and Publishing to Power BI Service. Power BI is a very powerful business intelligence tool. If Excel isn’t cutting it for your data analysis and modelling, then you likely need to move up to Power BI.
With this 2-hour crash course, you will learn how to import CSV, Excel, and Text files in Power BI and how to transform the data using Power Query. We then look at creating Lookup Tables and Merging Queries. We also cover Data Modelling basics such as creating Relationships between tables and creating a dynamic Date Table using DAX, as well as other DAX Power BI Formulas.
The second half of this video defines Calculated Columns vs Measures and how to create a Key Measures Table. We also teach you how to build a Power BI Report including adding Visualizations, adding Pages, Bookmarks, and Buttons, and Formatting. Finally, we show you how to pin Visualizations to a Dashboard before Publishing Reports to the Power BI Service.
Download the Free Instructor Files to follow along the course here: ►https://www.simonsezit.com/power-bi-crash-course-instructor-files/
Get a free, 30-day trial to Simon Sez IT ►https://bit.ly/3B5o3DK
Timestamp:
0:00:00 - Introduction to Power BI Desktop Part 1
0:01:51 - Agenda
0:03:59 - What is Power BI?
0:08:31 - Acquiring Power BI
0:15:16 - Importing CSV Files and Transforming Data
0:29:00 - Importing Excel Files and Text Files
0:32:21 - Creating Lookup Tables
0:40:21 - Merging Queries
0:46:42 - Data Modelling: Creating Relationship Between Tables
0:49:05 - Date Table Using DAX Expressions
0:59:32 - Introduction to Power BI Desktop Part 2
1:02:00 - Agenda
1:03:20 - Recap of Part 1
1:05:55 - Calculated Columns vs Measures
1:15:05 - Creating a Key Measures Table
1:19:07 - Adding Visualizations
1:28:17 - Adding Pages, Bookmarks, and Button
1:36:15 - Adding Filters
1:38:46 - Displaying and Formatting Overview Statistics
1:53:55 - Publishing Report to the Power BI Service
1:58:10 - Pinning Visualizations to a Dashboard
You can also check out our Power BI Playlist here: ►https://www.youtube.com/playlist?list=PLzj7TwUeMQ3i17tx3uoTc6xf9X7Nl2U-s
Watch other popular tutorials from Simon Sez IT:
Getting Started in Power BI (1.5-Hour Beginner Tutorial) ►https://youtu.be/Bx9SfwI3qhc
Excel Formulas (1+ Hour Beginner Tutorial) ►https://youtu.be/-Dqr44kopxQ
Excel Pivot Tables (2+ Hours Beginner Course) ►https://youtu.be/idgT7Gjf0P0
Microsoft SharePoint Online (1-Hour Beginner Crash Course) ►https://youtu.be/tdpWegAmZM0
Advanced Excel Formulas (1-Hour Crash Course) ►https://youtu.be/7cHwPFutzbQ
Other, free Microsoft playlists from Simon Sez IT:
Microsoft Excel 2019 Training Tutorials for Beginners playlist ►https://www.youtube.com/playlist?list=PLzj7TwUeMQ3gABy6lbJgp6kZtXVhadATg
Excel Long Tutorials playlist
►https://www.youtube.com/playlist?list=PLzj7TwUeMQ3g6U7Mwyy7G9Gwh-k2yNtfI
Stay in touch!
SimonSezIT.com: https://www.SimonSezIT.com/
StreamSkill.com: https://StreamSkill.com/
YouTube Channel: https://www.youtube.com/user/simonsezittraining
Subscribe to our channel:
https://www.youtube.com/simonsezittraining?sub_confirmation=1
If you enjoyed the video, please give a "thumbs up" and subscribe to the channel ;-)
Видео Microsoft Power BI for Beginners - 2 Hour Power BI Crash Course! канала Simon Sez IT
Показать
Комментарии отсутствуют
Информация о видео
Другие видео канала
 How to use Microsoft Power BI - Tutorial for Beginners
 Power BI Advanced Tutorial
 How to use Microsoft Power Query
 Mastering Microsoft Power BI - Create Power BI Report in 5 mins
 Creating a slicer that filters multiple columns in Power BI
 Power BI Report Design for Starters Tutorial
 Customer Overview Dashboard in Power BI
 Data Modeling (Star Schema 🌟) in Power BI – Creating Dimension Tables
 How to Build Power BI Reports from Start to Finish
 Getting Started in Power BI: Microsoft Power BI Tutorial for Beginners
 Power Virtual Agents Tutorial for Complete Beginners
 Create your first Power BI report (2021)
 Power Pivot Tutorial & Power Query in Excel - 1-Hour Class
 Power BI Advanced Tutorial
 What is Power BI? (2021)
 Visualizing Data with Power BI
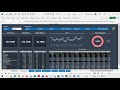 20 - Actual v Budget Dashboard with CUBEFUNCTIONS in Excel - Bernard Obeng Boateng
 Power BI Beginner Tutorial
 Microsoft Visio 2019 Tutorial: Visio Crash Course!