
- Популярные видео
- Авто
- Видео-блоги
- ДТП, аварии
- Для маленьких
- Еда, напитки
- Животные
- Закон и право
- Знаменитости
- Игры
- Искусство
- Комедии
- Красота, мода
- Кулинария, рецепты
- Люди
- Мото
- Музыка
- Мультфильмы
- Наука, технологии
- Новости
- Образование
- Политика
- Праздники
- Приколы
- Природа
- Происшествия
- Путешествия
- Развлечения
- Ржач
- Семья
- Сериалы
- Спорт
- Стиль жизни
- ТВ передачи
- Танцы
- Технологии
- Товары
- Ужасы
- Фильмы
- Шоу-бизнес
- Юмор
1 MT4 Getting Started :: Part of our MT4 Trader Education Video Series
Contact us now to find out how to get this entire series as a White Label offering for your website!
1 MT4 Getting Started
Welcome to your new installation of MT4.
Welcome to your new installation of MT5.
If you have ever used another trading platform, before now, you will find your new platform to be very flexible and user-friendly.
If you are new to trading, our goal is to help you embark on your journey and have you trading profitably as soon as possible.
Like any new venture, you cannot be expected to rush into it without understanding the tools of the trade.
In this case your new tools comprise the most popular trading platform in the world.
As with any video tutorial, you have the option of pausing and rewinding at any time to review.
In this lesson we will look at:
1. Viewing all available assets
2. Modifying your chart view
and
3. Different ways to display price action
When you first open the platform it might look something like this.
Here we have 4 different assets displayed, each with a variety of indicators showing.
If you don’t understand what you are seeing, don’t worry, we will go through everything step by step.
The first thing you need to do is to right click on this area, called Market Watch.
Select Show All.
You will now be able to trade every asset that your broker has on offer for your account.
OK, let’s create a simple chart view that might be a bit easier to read.
As with any Windows based program, the red X in the corner means Close, the small box means Maximise and this bar means Diminish.
Please close all charts except for one.
Let’s start by cleaning up the chart.
Right-click on the chart and select Indicators List.
Select and delete everything on the list.
Now we have what is called a Naked Chart without indicators, with only price, time and price action displayed.
If you don’t like the look of this chart, you can easily modify it by right clicking and selecting Properties.
Change the background to White.
Change the Foreground to Black.
Change the Bar Up to Green.
Change the Bar Down to Red.
Change the Bull Candle to Green.
Change the Bear Candle to Red.
Now, click Common and select Candlesticks and OHLC which means Open, High, Low, Close
Click OK. Now we have a more traditional looking chart.
Feel free to select any colour scheme you like as long as you can distinguish between Bull and Bear candles.
Bull candles open low and move up over time.
Bear candles open high and move down over time.
Open, High, Low, Close is displayed here and signifies the price action of each candlestick.
For example, this One-hour Bull Candle opened here and, one hour later, closed here.
During that hour, it traveled here to indicate the lowest price and, to here to indicate the highest price.
Each candle is made up of its body and, most often, two wicks.
Candlesticks are just one way that your platform displays price action.
Click here to view Bar Charts which display the same information as candles, and, Line Charts which show price as a continuous line.
For the purpose of this series of videos, we will display only Candlesticks.
One last thing. Click here to zoom in and out of your chart view.
In the next lesson, we will look at saving the chart we just made as a Template.
Видео 1 MT4 Getting Started :: Part of our MT4 Trader Education Video Series канала FX Large
1 MT4 Getting Started
Welcome to your new installation of MT4.
Welcome to your new installation of MT5.
If you have ever used another trading platform, before now, you will find your new platform to be very flexible and user-friendly.
If you are new to trading, our goal is to help you embark on your journey and have you trading profitably as soon as possible.
Like any new venture, you cannot be expected to rush into it without understanding the tools of the trade.
In this case your new tools comprise the most popular trading platform in the world.
As with any video tutorial, you have the option of pausing and rewinding at any time to review.
In this lesson we will look at:
1. Viewing all available assets
2. Modifying your chart view
and
3. Different ways to display price action
When you first open the platform it might look something like this.
Here we have 4 different assets displayed, each with a variety of indicators showing.
If you don’t understand what you are seeing, don’t worry, we will go through everything step by step.
The first thing you need to do is to right click on this area, called Market Watch.
Select Show All.
You will now be able to trade every asset that your broker has on offer for your account.
OK, let’s create a simple chart view that might be a bit easier to read.
As with any Windows based program, the red X in the corner means Close, the small box means Maximise and this bar means Diminish.
Please close all charts except for one.
Let’s start by cleaning up the chart.
Right-click on the chart and select Indicators List.
Select and delete everything on the list.
Now we have what is called a Naked Chart without indicators, with only price, time and price action displayed.
If you don’t like the look of this chart, you can easily modify it by right clicking and selecting Properties.
Change the background to White.
Change the Foreground to Black.
Change the Bar Up to Green.
Change the Bar Down to Red.
Change the Bull Candle to Green.
Change the Bear Candle to Red.
Now, click Common and select Candlesticks and OHLC which means Open, High, Low, Close
Click OK. Now we have a more traditional looking chart.
Feel free to select any colour scheme you like as long as you can distinguish between Bull and Bear candles.
Bull candles open low and move up over time.
Bear candles open high and move down over time.
Open, High, Low, Close is displayed here and signifies the price action of each candlestick.
For example, this One-hour Bull Candle opened here and, one hour later, closed here.
During that hour, it traveled here to indicate the lowest price and, to here to indicate the highest price.
Each candle is made up of its body and, most often, two wicks.
Candlesticks are just one way that your platform displays price action.
Click here to view Bar Charts which display the same information as candles, and, Line Charts which show price as a continuous line.
For the purpose of this series of videos, we will display only Candlesticks.
One last thing. Click here to zoom in and out of your chart view.
In the next lesson, we will look at saving the chart we just made as a Template.
Видео 1 MT4 Getting Started :: Part of our MT4 Trader Education Video Series канала FX Large
MT4 Trader Education Videos Forex Trading Trading Video Content Content Video cfd MT4 Content MT4 Video How to set up MT4 Learn MT4 White Label Videos Trading Education Trader Education mt4 forex metatrader metatrader 4 trading learn fx mt4 tutorials how to how to use mt4 market stock currency expert advisor video content for website video production forex video production trading video production broker fx broker marketing video compelling content
Комментарии отсутствуют
Информация о видео
12 декабря 2017 г. 22:14:31
00:04:25
Другие видео канала
 Forex Source for Brokers Introduction
 Las Diferencias entre NinjaTrader 8 y MetaTrader 4 :: Gráficos
 cTrader Web from Spotware :: Calendar and Analysis Upgrade 2020
 MT5 Basic Graphics Tutorial Step by Step #mt5 #forexeducation #fibonacci
 2 MT4 Templates :: Part of our MT4 Trader Education Video Series
 Gold Trading Webinar for Valutrades
 White-Label Video for FX Brokers: 1 Match Trader FX Large Intro #brokercontent #fxbrokervideos
 Acuity Trading's MT4 Research Terminal
 Quox Platform Tour
 8 FX Large DXtrade Mobile Overview May 2026
 4 DXtrade Basic Graphics for FX/CFD Brokers | White Label Trading Videos #DXtrade #forex
 1 DXtrade Platform Overview for FX/CFD Brokers | White Label Videos #DXtradeVideos #forexcontent
 3 Sample Only MT5 Templates ChTrad
 header video
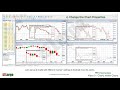 Sample Video 9 :: MT5 Charts within Charts
 Gold-i's Matrix Video
 19 June 2017 :: Brexit Begins! What to watch out for!
 FX Large :: Overview Video :: Compelling Content for Capital Markets
 2 DXtrade Watchlists for FX/CFD Brokers | White Label Videos #forexcontent #broker
 Cantonese Video 3 ADSS OREX MOBILE PLATFORM Symbols and Charts
