Microsoft Project: Using Graphical Indicators
Sir Ganttalot explains that getting the "big picture" on a project can be difficult if you have to interpret hundreds of tasks one by one to find out which ones are good in terms of progress and baseline variance, and which ones are not. Adding Graphical Indicators to a Gantt Chart can help you zero in tasks which are going well, or going badly. In this video Sir Ganttalot explains what Graphical Indicators are, and how to create them and use them in your project schedules. Sir Ganttalot is sponsored by Westall Murray International, Inc. www.WestallMurray.com
Видео Microsoft Project: Using Graphical Indicators канала SirGanttalot
Видео Microsoft Project: Using Graphical Indicators канала SirGanttalot
Показать
Комментарии отсутствуют
Информация о видео
Другие видео канала
 Project 2016 for Beginners Part 13: How to Set Project Milestones in MS Project 2016
![How To Create A Powerful Point Of Sale (POS) Application In Excel [Full Training & Free Download]](https://i.ytimg.com/vi/C-jw10s8esw/default.jpg) How To Create A Powerful Point Of Sale (POS) Application In Excel [Full Training & Free Download]
How To Create A Powerful Point Of Sale (POS) Application In Excel [Full Training & Free Download] How to create Status indicators in Microsoft Project - Graphical Indicators in Gantt chart
 Microsoft Project: An Easy Alternative to Baselining
 Microsoft Project - Conditional Formatting in Gantt Charts
 Microsoft Project Tips & Tricks 2017
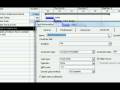 Microsoft Project - Task Types (Fixed Work, Units, Duration)
 Project Beginner Tutorial
 Baselining Best Practices with Microsoft Project
 Create status indicators in Microsoft Project to identify late tasks - Very Easy |NiksProjects
 Microsoft Project 2010/2013 pt 4 (Advanced Formatting & Views)
 How to create Stop Light status in MS Project
 Scheduling for Success with Microsoft Project
 MS Project-Setting up a Baseline.mp4
 How to Level Resources in Project 2016
 MS Project Planned Percentage Complete Vs Actual Percentage complete - Updated Improved version
 Change Colour of Gantt Chart Bars Automatically
 Microsoft Project Tips & Tricks
 Learn Microsoft Project in 15 Minutes
 MS Project ● Les bases ● En 20 minutes