How to Analyse LIKERT SCALE QUESTIONNAIRE the right way
Likert scale can be analyzed by computing mean for all the items per every variable or through Principle component analysis. In this video we take you through step by step process of analysis of Likert scale responses. We can fit OLS regression with a likert- scale data after running PCA or average mean if the precondition ( assumptions) are all satisfied otherwise Likert scale is an ordinal ranked response and we should run Ordinal Logistic Model.
Subscribe to our YouTube https://youtu.be/ngRkLGwfhrY
Видео How to Analyse LIKERT SCALE QUESTIONNAIRE the right way канала Norwegian Research Training Institute
Subscribe to our YouTube https://youtu.be/ngRkLGwfhrY
Видео How to Analyse LIKERT SCALE QUESTIONNAIRE the right way канала Norwegian Research Training Institute
Показать
Комментарии отсутствуют
Информация о видео
17 августа 2020 г. 14:21:13
01:19:47
Другие видео канала
 Analysing Questionnaires
 How to run data analysis using SPSS | Likert Scale | Correlation | t-test | Chi Square
 How to tabulate, analyze, and prepare graph from Likert Scale questionnaire data using Ms Excel.
 How to analyze Likert Scale in SPSS and interpret the results in Word
 Conducting an Ordinal Regression in SPSS with Assumption Testing
 How to Calculate Relative Important Index for Likert scales variables ?
 Proportional odds (ordinal) regression for likert scales in SPSS
 How to Use SPSS: Factor Analysis (Principal Component Analysis)
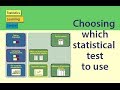 Choosing which statistical test to use - statistics help.
 Likert Scale Analysis - Mean and Standard Deviation
 Learn SPSS in 15 minutes
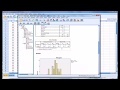 Normality Tests in SPSS
 SPSS Tutorial for data analysis | SPSS for Beginners
 Spearman Correlation SPSS Step-By-Step Guide
 Ordinal logistic regression using SPSS (July, 2019)
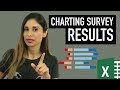 Charting Survey Results in Excel (Visualize Employee Satisfaction results)
 Likert Scales 1.1
 Is Likert type Scale Ordinal or Interval Data? Predictive analytics series
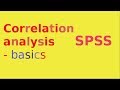 SPSS for questionnaire analysis: Correlation analysis
 02 Descriptive Statistics and Frequencies in SPSS – SPSS for Beginners