Prometheus And Grafana Together // Explained with DEMO // Kubernetes Monitoring
In this Kubernetes monitoring video, we are going to dive deep into Kubernetes monitoring. We are going to learn what is Prometheus, how does Prometheus run behind the scene, Prometheus demo. Then we will understand what is Grafana and why we need it, explain step by step Grafana demo, along with explaining how to import/export dashboards. Demo done on EKS server.
Deploy Metrics server: https://docs.aws.amazon.com/eks/latest/userguide/metrics-server.html
Prometheus installation: https://docs.aws.amazon.com/eks/latest/userguide/prometheus.html
Grafana installation steps: https://github.com/saha-rajdeep/eks-demos/blob/master/Install_grafana.txt
💰👨🎓 Get my courses with max discount and 30 day moneyback guarantee: https://bit.ly/3Eku9RH
**Connect with me**
🤳 Instagram: https://www.instagram.com/cloudwithraj/
🏢 LinkedIN: https://www.linkedin.com/in/rajdeep-sa-at-aws/
🐦Twitter: https://twitter.com/cloudwithraj
🖼 Facebook: https://www.facebook.com/cloudwithraj
TIMESTAMPS:
00:00 Intro
00:57 What is Prometheus
01:27 Prometheus running as daemon
02:41 Prometheus demo
07:41 Grafana - what and why
08:40 Grafana demo
14:03 Explaining graph IDs for Grafana
Видео Prometheus And Grafana Together // Explained with DEMO // Kubernetes Monitoring канала Cloud With Raj
Показать
Комментарии отсутствуют
Информация о видео
Другие видео канала
 How Prometheus Monitoring works | Prometheus Architecture explained
 Solutions Architect Interview Questions AWS
 kuberenetes monitoring with prometheus and grafana
 Meet Grafana LOKI, a Log Aggregation System for EVERYTHING
 Grafana Alerts with Prometheus and Node Exporter Metrics - Introduction
 How to Create GKE Cluster Using TERRAFORM from Scratch? (GCP Shared VPC | Terraform GCP Kubernetes)
 Monitoring using Prometheus and Grafana | ADAM
 Grafana Explained in Under 5 Minutes ⏲
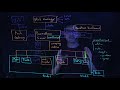 Monitoring Kubernetes with Prometheus & Grafana (1/5)
 Grafana : Setup Grafana for Spring Boot app | Actuator, Prometheus & Grafana | Monitoring & Alerting
 Kubernetes monitoring with Prometheus and Grafana
 What is Helm in Kubernetes? Helm and Helm Charts explained | Kubernetes Tutorial 23
 Setup Prometheus Monitoring on Kubernetes using Helm and Prometheus Operator | Part 1
 Grafana Tutorial For Beginners | Continuous Monitoring With Grafana | DevOps Training | Edureka
 How to setup Prometheus, Grafana and Node Exporter on Docker and import a opensource dashboard
 Server Monitoring // Prometheus and Grafana Tutorial
 AWS EKS CI/CD: Cluster Set-up, App containerization & Deployment, CodePipeline| DevOps With AWS Ep10
 Grafana Loki: Like Prometheus, But for logs. - Tom Wilkie, Grafana Labs
 Grafana Dashboard📊: Monitor CPU, Memory, Disk and Network Traffic Using Prometheus and Node Exporter