Statistics 101: Visualizing Type I and Type II Error
Statistics 101: Visualizing Type I and Type II Error.
In this video we attempt to make the concept of Type I and Type II error more concrete by placing samples on distribution curves. We tie together the null and alternative hypotheses, sampling processes, and rejection/failure to reject the null hypotheses. Both two-tailed and one-tailed hypothesis are explained including the effects of alpha on Type I and Type II error. Rejection and nonrejection regions are also explored. This video prepares us for and hints at the next step: hypothesis testing. Enjoy!
For my complete video library organized by playlist, please go to my video page here:
http://www.youtube.com/user/BCFoltz/videos?flow=list&view=1&live_view=500&sort=dd
Видео Statistics 101: Visualizing Type I and Type II Error канала Brandon Foltz
Показать
Комментарии отсутствуют
Информация о видео
Другие видео канала
 Statistics 101: Single Sample Hypothesis Z-test Concepts
 Statistics 101: Type I and Type II Error Examples
 Type I and II Errors, Power, Effect Size, Significance and Power Analysis in Quantitative Research
 Statistics 101: Single Sample Hypothesis t-test Concepts
 Statistics 101: Calculating Type II Error, Concept with Example
 Statistics 101: Linear Regression, The Very Basics 📈
 Type I Errors, Type II Errors, and the Power of the Test
 Statistics 101: Confidence Interval Estimation, Sigma Known
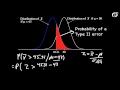 Calculating Power and the Probability of a Type II Error (A One-Tailed Example)
 Statistics 101: Standard Error of the Mean
 Statistics 101: Introduction to Hypothesis Formulation
 Statistics 101: Sample Mean Proximity to Population Mean
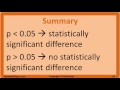 Null Hypothesis, p-Value, Statistical Significance, Type 1 Error and Type 2 Error
 Statistics 101: Type I and Type II Errors
 Statistics 101: To z or to t, That is the Question
 Intro to Hypothesis Testing in Statistics - Hypothesis Testing Statistics Problems & Examples
 Statistics 101: ANOVA, A Visual Introduction
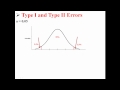 Type I and Type II Errors
 Error Type (Type I & II)