Advanced Pivot table tricks for Reporting and Analysis
Learn 6 advanced pivot table tips and tricks for Microsoft Excel, specially if you are involved in financial reporting and analysis.
Download the Excel file here: https://bit.ly/37Sfe4v
Course:
If you would like to learn in detail, how to calculate sales variances and the impact they have on sales $, profit $ and profit margin %, and how to explain performance vs budget and prior periods, click on the link for a detailed video course (at a special price). You will also learn how to analyse and present the results of the variances to management and will be able to download solved variance calculation Excel templates. https://bit.ly/3xjMR8t
Some Recommendations:
Are you a First Time or New Manager? Check this out: https://amzn.to/35qWzLc
Learn pivot table data crunching business skills here: https://amzn.to/3lgYB5E
Learn all about Excel in one place: https://amzn.to/3laCXQx
Videos you may like:
Learn the right way to use Vlookup: https://youtu.be/JhISkMFhrik
Fastest way to convert numbers stored as text: https://youtu.be/_OpzVbw7tkw
Learn the basics of pivot tables: https://youtu.be/qEL695eaB6E
Create automated waterfall chart: https://youtu.be/K-cPZjA8EzE
Microsoft Excel pivot tables are a great tool for simplifying data analysis and reporting. It pays off to learn these advanced pivot table tips and tricks as it can save you hours in time, and also increases your accuracy. The advanced pivot table tips and tricks are a musk know for everyone involved in analyzing data or creating and presenting reports.
Apply custom filter using Grouping
Grouping to create Data Range or buckets
Grouping Dates using Pivot tables
Creating Pivot table calculated fields
Combining and analyzing two reports in different formats
Pivot table slicers and slicer connections
We will start with the powerful grouping function available with the pivot tables. We will look at different examples of grouping, including custom grouping when you want to create a new group that is not available in the source data. After creating custom grouping, you will be able analyze data at the new group level which is extremely useful.
Connect:
https://www.instagram.com/learnaccountingfinance
https://www.learnaccountingfinance.com
We will then look at creating data bands or data range groups, which helps with analyzing data by putting them in various buckets or range of values. this is a great way to analyze data (including creating a Histogram), and gives you a much deeper insight into the data.
We will also look at grouping dates in a pivot table. And then we will look at how calculated fields can be added to a pivot table further enhancing our ability to analyze and report information. The calculated fields work with the new new groups that we have created as well, hence making it a great and powerful tool for data analysis.
We will then look at a trick that I learnt early in my career to combine to sources of data which are formatted differently but have some information in common, and can be analyzed together. An example is we have separate data set for actual results and budget, and we want to compare actual results with budget side by side, but since the reports are in different format, we are not able to compare them. Using the trick I share in the video, you will learn how with a small tweak of data you can analyze actual results vs budget even though the source data is different in format.
And finally we will look at pivot table slicers which are a great tool for filtering data and connecting multiple pivot tables together. Most of the Excel dashboards are created using the Slicers.
I hope you find the information and tips and tricks provided in the video useful and it helps you analyze data better, faster and more accurately.
Dont forget to hit thumbs up and subscribe to Learn Accounting Finance.
Видео Advanced Pivot table tricks for Reporting and Analysis канала Learn Accounting Finance
Показать
Комментарии отсутствуют
Информация о видео
Другие видео канала
 ☑️ Top 25 Advanced Pivot Table Tips & Tricks For Microsoft Excel
 Easy Excel PivotTable Profit & Loss Statements
 How to use XLOOKUP the Game Changer 🎮 (Vlookup function Upgraded)
 4 SMART Ways to use Custom Formatting instead of Conditional Formatting in Excel - Part 1
 Secrets to Building Excel Dashboards in Under 15 Minutes!
 Advanced Pivot Table Techniques: Combine Data from Multiple Sheets in Excel
 50 Ultimate Excel Tips and Tricks for 2020
 Don't Use Excel Filters! Use This Incredible Excel Formula Instead ...
 Pivot Table with Progress Chart and Dashboard
 Pivot Table Automation with Calculated Field and Calculated Item (When and How to Use Each)
 Advanced PivotTables: Combining Data from Multiple Sheets
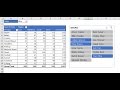 PivotTables & Slicers Made Easy! 4 Amazing Examples for WAAT Accounting Seminar August 26, 2016
 Advanced Pivot Tables Tutorial in Excel - 2.5 Hour Pivot Table Excel Course
 How to build Interactive Excel Dashboards
 9 Useful Excel Pivot Table Tips everyone should know
 How To Pass Advanced Excel Test For Job Interview
 How to Lookup Names with Spelling Errors (All types of Spelling mistakes), Excel Vlookup and Xlookup
 How to use Microsoft Power Query
 Advanced Pivot Table Techniques (to achieve more in Excel)
 Excel PivotTables Made Easy - And Why Things Go Wrong!