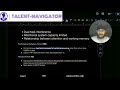
LINEAR LOGISTIC REGRESSION, L1 L2 REGULARIZATION, PCA, METRICS Which Ones REALLY Matter?
LINEAR LOGISTIC REGRESSION, L1 L2 REGULARIZATION, PCA, METRICS Which Ones REALLY Matter?
In-depth Exploration of Supervised and Unsupervised Learning: Linear & Logistic Regression, Regularization, PCA, and Ensemble Methods.
[00:02](https://www.youtube.com/watch?v=jOSMD-GISCQ&t=2) Overview of linear regression in supervised learning.
- Linear regression predicts continuous outcomes by modeling linear relationships between dependent and independent variables.
- The equation y = β0 + β1x1 + β2x2 + ... + βnxn + ε represents the relationship, where β are coefficients and ε is the error term.
[00:25](https://www.youtube.com/watch?v=jOSMD-GISCQ&t=25) Logistic regression for classification with pros and cons overview.
- Logistic regression predicts class membership and models probabilities for binary or multiclass scenarios.
- Advantages include ease of computation, while disadvantages highlight sensitivity to outliers and inability to handle nonlinear relationships.
[00:50](https://www.youtube.com/watch?v=jOSMD-GISCQ&t=50) Logistic regression uses the sigmoid function and contrasts L1 and L2 regularization.
- The sigmoid function compresses output between 0 and 1, facilitating binary classification in logistic regression.
- L1 regularization (lasso) adds a penalty of the absolute value of coefficients, while L2 regularization adds the square of coefficients to the loss function.
[01:17](https://www.youtube.com/watch?v=jOSMD-GISCQ&t=77) L1 and L2 regularization differ in feature selection and weight management.
- L1 regularization can drive some feature weights to zero, effectively performing feature selection.
- L2 regularization shrinks weights but retains all features, ensuring they all contribute to the model.
[01:38](https://www.youtube.com/watch?v=jOSMD-GISCQ&t=98) L2 regularization retains all features while enhancing model complexity.
- L1 regularization simplifies models by selecting important features, making them more interpretable.
- Clustering is an unsupervised learning method that groups similar data points, with K-means being a popular algorithm.
[02:00](https://www.youtube.com/watch?v=jOSMD-GISCQ&t=120) Overview of clustering, centroids, and PCA for dimensionality reduction.
- Clustering methods assign data points to centroids, iterating until stable centroids are achieved, but are sensitive to initial conditions.
- PCA, or Principal Component Analysis, reduces data dimensionality by projecting it onto lower dimensions while preserving variance.
[02:24](https://www.youtube.com/watch?v=jOSMD-GISCQ&t=144) Standardization and evaluation metrics in regression analysis.
- Standardizing data involves transforming variables to have a mean of zero and a standard deviation of one, improving model performance.
- R square measures model variance explained while adjusted R square accounts for the number of predictors, aiding model comparison.
[02:48](https://www.youtube.com/watch?v=jOSMD-GISCQ&t=168) Comparison of bagging and boosting in ensemble learning techniques.
- Bagging reduces variance through parallel ensemble methods, exemplified by Random Forests.
- Boosting reduces bias using sequential methods, effective for high-variance models like AdaBoost.
Key Insights for [lin log regressin, regulrztion,pca,metrics and other qna, baggin boostin📊]
- L1 regularization (Lasso) penalizes the absolute value of coefficients, effectively driving some weights to zero and enabling feature selection.
- L2 regularization (Ridge) adds a penalty proportional to the square of the coefficients, keeping all features but shrinking their weights.
- L1 is preferred for sparse data while L2 is used when all features are deemed important for model performance.
- Clustering is an unsupervised learning method that groups similar data points.
- The K-Means algorithm requires a predefined number of clusters (K) and iteratively assigns points to the nearest centroid until convergence.
**Principal Component Analysis (PCA)**
- PCA is a dimensionality reduction technique that projects data onto lower dimensions while preserving variance.
- The process includes data standardization, computing the covariance matrix, and then deriving eigenvalues and eigenvectors.
- PCA is commonly used for data visualization and as a preprocessing step before applying machine learning models.
**Model Evaluation Metrics**
- R-squared measures the percentage of variance in the target variable explained by the model, while adjusted R-squared accounts for the number of predictors.
- The confusion matrix evaluates classification performance by summarizing true positives, false positives, true negatives, and false negatives.
- Adjusted R-squared is particularly useful when comparing models with different numbers of predictors.
**Ensemble Learning: Bagging vs. Boosting**
Видео LINEAR LOGISTIC REGRESSION, L1 L2 REGULARIZATION, PCA, METRICS Which Ones REALLY Matter? канала Talent Navigator
supervised learning unsupervised learning linear regression logistic regression l1 regularization l2 regularization ridge regression lasso regression pca explained principal component analysis clustering k means machine learning basics bagging vs boosting ensemble learning model evaluation metrics adjusted r squared data science tutorials ml interview prep machine learning concepts deep learning linear regression analysis data analysis ml regression ai
Комментарии отсутствуют
Информация о видео
16 июля 2025 г. 1:15:08
00:03:07
Другие видео канала