- Популярные видео
- Авто
- Видео-блоги
- ДТП, аварии
- Для маленьких
- Еда, напитки
- Животные
- Закон и право
- Знаменитости
- Игры
- Искусство
- Комедии
- Красота, мода
- Кулинария, рецепты
- Люди
- Мото
- Музыка
- Мультфильмы
- Наука, технологии
- Новости
- Образование
- Политика
- Праздники
- Приколы
- Природа
- Происшествия
- Путешествия
- Развлечения
- Ржач
- Семья
- Сериалы
- Спорт
- Стиль жизни
- ТВ передачи
- Танцы
- Технологии
- Товары
- Ужасы
- Фильмы
- Шоу-бизнес
- Юмор
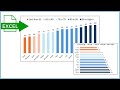
How to make a Stacked Clustered Bar Chart with 3 categories in Excel
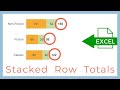
Learn to create a stacked, clustered column chart in Microsoft Excel that is nicely formatted so it is easy to understand. The example we use is the number of employees reported by three categories: department, location, and type (full-time/part-time). This video explains how to:
1) Display totals above each stacked bar
2) Insert a gap (extra space) between the clusters
3) Customize the horizontal axis labels to include the total value for each cluster
4) Apply professional formatting with colors, patterns, a meaningful title, and legend
PRACTICE FILE - click this link to download the Excel workbook used in the video (it will be saved in the default download folder on your computer):
https://datadesignstyle.com/wp-content/uploads/2025/04/Practice_StackedClusterChart_byDataDesignStyle.xlsx
..................................................
Chapters:
00:00 Intro
00:40 Data source
01:07 Create chart
01:52 Totals above bars
02:40 Gap between clusters
05:00 Customize axis labels
06:33 Final formatting
08:03 Summary
..................................................
Website: https://www.DataDesignStyle.com
Video is made using Filmora
Видео How to make a Stacked Clustered Bar Chart with 3 categories in Excel канала Data Design Style
Комментарии отсутствуют
Информация о видео
15 апреля 2025 г. 18:23:53
00:08:49
Другие видео канала