Principal Component Analysis (PCA) Explained: Dominating Data Directions with Most Variance | Part 1
PCA Explained: Dominating Data Directions with Maximum Variance | Part 1 | 5-Minute Analytics
Mastering PCA: Unveiling the Power of Variance in Data Analysis and Machine Learning
Machine Learning with Python: PCA Analysis
A Step-by-Step Explanation of Principal Component Analysis (PCA)
Learn how to use a PCA when working with large data sets.
⏱️Table of Contents⏱️ for "PCA Explained: Dominating Data Directions with Maximum Variance | Part 1 | 5-Minute Analytics"
Chapters:
0:16 Outline
0:49 PCA Question: Which of the following countries is different from others?
1:10 PCA Example - 17 features or dimensions
1:20 PCA Definition focusing on variance
1:27 Directions with Most Variance
1:40 Dimension Reduction
2:41 What is the Variance? A Simple Example
3:13 Calculation of Mean
4:03 Some Examples of Normal Distribution with Similar Mean Values and Different Variances
#data
#dataanalytics
#dataanalysis
#visualization
#Introduction
#5minuteanalytics
#machinelearning
#pca
#DrRezaRafiee
Like and subscribe for a new video every other week!
Activate the 🔔 beside the subscribe button to get a notification! ✉
Produced by: Dr Reza Rafiee; @5MinuteAnalytics
Music by @ClickRhythm
All Rights Reserved!
©2024
PCA aims to reduce the dimensionality of the data by identifying the directions which is called principal components along which the data varies the most. These principal components are ordered by the amount of variance they explain. The first principal component captures the highest variance in the data, followed by the second, third, and so on.
Variance: helps to understand the data’s variability and structure.
Most important part of the data: PCA components captures the highest variance.
Dimension reduction: PCA aims to identify directions by which the data variation is the most.
Principal components (PC): Direction with the highest variance forms the first component.
Direction with the second highest variance forms the second component and so on.
Principal component analysis: a review and recent developments
So, in terms of variance, the most crucial part is identifying and retaining the principal components that explain the most variance as they represent the most significant and informative aspects of the data.
The prevalence of large datasets poses challenges in #interpretation, prompting the adoption of techniques like Principal Component Analysis (PCA). PCA serves to enhance #interpretability by reducing dataset #dimensionality while minimizing information loss. This is achieved by generating new uncorrelated variables, termed principal components, which sequentially maximize variance. The process involves solving an #eigenvalue/#eigenvector problem. Notably, PCA is #adaptive, as it tailors the analysis to the specific dataset rather than relying on predetermined factors. Moreover, various PCA variants cater to different data types and structures, further highlighting its adaptability. This video will initially introduce the fundamental concepts of PCA including variance and explain what PCA can and cannot do, and then explore different versions of PCA and how they can be used in real-world situations by using Python programming.
Видео Principal Component Analysis (PCA) Explained: Dominating Data Directions with Most Variance | Part 1 канала 5-Minute Analytics
Показать
Комментарии отсутствуют
Информация о видео
Другие видео канала
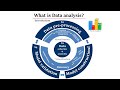 What is Data analysis? | 5-Minute Analytics
 Revolutionizing Communication with ChatGPT | Part1: 5-Minute Analytics Overview
 Data Analysis and Visualisation Review | Addressing Missing Data
 R Programming Tutorial 3 | Learn the Basics of Data Analysis and Statistical Computing
![GPT-4 | OpenAI’s Most Advanced System [5-Minute Analytics Overview]](https://i.ytimg.com/vi/R22Cuhpfp64/default.jpg) GPT-4 | OpenAI’s Most Advanced System [5-Minute Analytics Overview]
GPT-4 | OpenAI’s Most Advanced System [5-Minute Analytics Overview]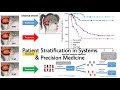 Survival Analysis | Patient Stratification in Systems and Precision Medicine
 What does "Professionalism" mean to you?
 Survival Analysis | Part 2 | Patient Stratification in Systems and Precision Medicine
 What is OpenAI ChatGPT, GPT4 and How to Use GPT4 Free (without ChatGPT Plus)
 Start Today NOT Tomorrow! | Short Motivational & Inspirational Video
 How to Do Database Normalisation | Different Forms of Database Normalisation | UNF, 1NF, 2NF & 3NF
 R Programming Tutorial 1 | Learn the Basics of Data Analysis and Statistical Computing
 Principles and Practices of Machine Learning | Overview
 Data Analysis & Visualisation | Title
 Database Normalisation | from UNF to 3NF
 Survival Analysis | Part 1 | Patient Stratification in Systems and Precision Medicine
 Introduction to Normalisation | Databases
 R Programming Tutorial 2 | Learn the Basics of Data Analysis and Statistical Computing
 From Cancer to Data | A Scientific Journey
 Database Conceptual Design| Entities and Relationships