What is Data analysis? | 5-Minute Analytics
What is Data analysis? A Complete Guide | 5-Minute Analytics
Machine Learning with Python: Introduction
Data analysis is the practice of working with data to glean useful information, which can then be used to make informed decisions.
⏱️Table of Contents⏱️ for "What is Data analysis? A Complete Guide | 5-Minute Analytics"
Chapters:
0:50 What is data analysis?
1:28 Data definition
1:50 Pre-processing: Inspecting, Cleaning, Transforming
2:07 Key components of data analysis
2:24 Data visualisation (Scatter Plot, Heatmap, Histogram)
2:41 The main sources of generating data
3:29 Types of data
4:39 Examples of data & dataset in different applications such as UK food consumption
5:25 Iris dataset
#data
#dataanalytics
#dataanalysis
#visualization
#Introduction
#5minuteanalytics
#machinelearning
#DrRezaRafiee
Like and subscribe for a new video every other week!
Activate the 🔔 beside the subscribe button to get a notification! ✉
Produced by: Dr Reza Rafiee; @5MinuteAnalytics
Music by @ClickRhythm
All Rights Reserved!
©2023
Definition of Data Analysis
Data analysis is a systematic approach or method used to employ techniques for the purpose of describing, drawing conclusions from, or assessing data. It involves the collection and organisation of data, enabling researchers to examine the information and identify relationships between variables. In statistics, data analysis often entails interpreting raw data to unveil connections between different data points. For instance, if a researcher aims to investigate children's math achievement, they would gather data on factors like age, gender, grade level, and mathematics grades. Subsequently, this raw data is subjected to specific statistical tools and software to reveal correlations between the various variables.
Both qualitative and quantitative research methodologies employ distinct data analysis procedures. Qualitative research is a process that emphasises gaining insights and understanding individuals or groups under study. Data collection methods such as observations and interviews are integral to this approach.
In contrast, quantitative research centres around numerical data and reasoning. Surveys and measurements are employed to gather data in this methodology. For instance, a company seeking customer feedback on their store's performance would use surveys to collect relevant data. In quantitative research, data analysis revolves around numbers and relies on statistical software for analysis. On the other hand, qualitative research necessitates the researcher to analyse non-numerical data, such as interview transcripts. This process is often referred to as "coding," where the researcher identifies recurring themes and patterns within the interview data.
Purposes and Applications of Data Analysis
The primary objective of data analysis is to derive meaningful insights from specific datasets. Researchers leverage these insights to arrive at conclusions relevant to their studies. Data analysis serves the purpose of uncovering intentional findings, formulating conclusions, facilitating decision-making, and either substantiating or refuting previous research.
For instance, consider a researcher seeking to explore the correlation between math classrooms that incorporate hands-on activities and student performance. The data reveals that classrooms utilising hands-on activities exhibit a higher average performance in mathematics. Consequently, the researcher can deduce that the integration of hands-on activities in math classes can lead to improved academic outcomes. This research also enables the conclusion that educational institutions should consider implementing hands-on activities to enhance the overall average class performance.
What is Involved in Data Analysis?
Data collection and assembly: Researchers begin by evaluating the research question and selecting an appropriate methodology for collecting and assembling data effectively.
Data pre-processing: In this stage, researchers meticulously examine the collected data, identifying and rectifying any errors. Ensuring the accuracy of the data is crucial for the research's validity.
Model construction and model validation, including data visualisation: Researchers thoroughly analyse the data to identify recurring themes or common word phrases. For numerical data, specialised software is often employed to construct and validate models, and data is visually represented through charts, maps, or graphs. In qualitative research, excerpts of phrases and quotes may be used to demonstrate thematic analysis or recurring phrases within the data. This step facilitates the comparison of relationships and data sets, contributing to a deeper understanding of the conclusions reached by the researchers.
Видео What is Data analysis? | 5-Minute Analytics канала 5-Minute Analytics
Показать
Комментарии отсутствуют
Информация о видео
Другие видео канала
 Revolutionizing Communication with ChatGPT | Part1: 5-Minute Analytics Overview
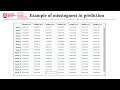 Data Analysis and Visualisation Review | Addressing Missing Data
 R Programming Tutorial 3 | Learn the Basics of Data Analysis and Statistical Computing
![GPT-4 | OpenAI’s Most Advanced System [5-Minute Analytics Overview]](https://i.ytimg.com/vi/R22Cuhpfp64/default.jpg) GPT-4 | OpenAI’s Most Advanced System [5-Minute Analytics Overview]
GPT-4 | OpenAI’s Most Advanced System [5-Minute Analytics Overview]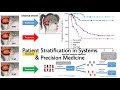 Survival Analysis | Patient Stratification in Systems and Precision Medicine
 What does "Professionalism" mean to you?
 Survival Analysis | Part 2 | Patient Stratification in Systems and Precision Medicine
 What is OpenAI ChatGPT, GPT4 and How to Use GPT4 Free (without ChatGPT Plus)
 Start Today NOT Tomorrow! | Short Motivational & Inspirational Video
 How to Do Database Normalisation | Different Forms of Database Normalisation | UNF, 1NF, 2NF & 3NF
 R Programming Tutorial 1 | Learn the Basics of Data Analysis and Statistical Computing
 Principles and Practices of Machine Learning | Overview
 Data Analysis & Visualisation | Title
 Database Normalisation | from UNF to 3NF
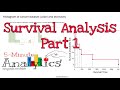 Survival Analysis | Part 1 | Patient Stratification in Systems and Precision Medicine
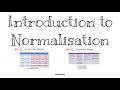 Introduction to Normalisation | Databases
 R Programming Tutorial 2 | Learn the Basics of Data Analysis and Statistical Computing
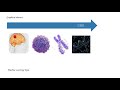 From Cancer to Data | A Scientific Journey
 Database Conceptual Design| Entities and Relationships
 Principal Component Analysis (PCA) Explained: Dominating Data Directions with Most Variance | Part 1