Highline Excel 2016 Class 17: How to Build Excel Dashboard PivotTable, Chart, Conditional Formatting
Download Files: https://people.highline.edu/mgirvin/AllClasses/218_2016/218Excel2016.htm
In this video learn about how to build Excel Dashboard based on Data Model and see first DAX Measure (Formula):
1. (00:22) Introduction
2. (02:43) Power Query to Clean, Transform & Import Text Files (From Folder feature)
3. (09:35) Import Data into Power Pivot Data Model
4. (11:23) PivotTable #1: for Month & Year Revenue
5. (11:38) Group Dates in PivotTable based on Data Model: Automatically adds Columns to Data Model Table.
6. (13:38) First DAX Measure: "Formula for PivotTable"
7. (19:04) Add Slicer to Multiple PivotTables
8. (19:52) Chart #1: Line Chart for Month and Year Data
9. (20:27) Name PivotTables
10. (21:20) PivotTable #2: Revenue for each SalesRep. Name Pivot. Connect to Slicer.
11. (22:39) Chart #2: Bar Chart for SalesRep Revenue
12. (23:52) PivotTable #3: Create Year PivotTable. Name Pivot. Connect to Slicer.
13. (26:00) Create Text Label for Chart #2 based on PivotTable #3 and Slicer.
14. (27:10) PivotTable #4: Cross Tabulated Table for Product and Region.
15. (28:45) Conditional Formatting for PivotTable #4.
16. (29:58) Paste Linked Picture of PivotTable in Dashboard
17. (30:48) Add formatting and Alignment to Dashboard
18. (33:25) Add new Text Files to Folder and Refresh Dashboard
19. (34:59) Edit Query to remove data from Dashboard.
20. (35:38) Summary
Reference Video:
Excel Magic Trick 1379: Power Query Combine Binary "Expand Button" January 2017 Update
https://www.youtube.com/watch?v=KqIMWTnkUiU
Видео Highline Excel 2016 Class 17: How to Build Excel Dashboard PivotTable, Chart, Conditional Formatting канала ExcelIsFun
Показать
Комментарии отсутствуют
Информация о видео
Другие видео канала
 Highline Excel 2016 Class 15: Excel Charts to Visualize Data: Comprehensive Lesson 11 Chart Examples
 Highline Excel 2016 Class 18: Clean & Transform Data: Replace, Flash Fill, Text To Columns, Formulas
 How to build Interactive Excel Dashboards that Update with ONE CLICK!
 Excel Dashboard - Plan vs Actual Variances - FREE Download
 Advanced Pivot Table Techniques (to achieve more in Excel)
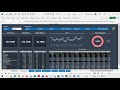 20 - Actual v Budget Dashboard with CUBEFUNCTIONS in Excel - Bernard Obeng Boateng
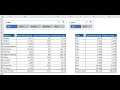 Highline Excel 2016 Class 03: Data Analysis Fundamentals: PivotTables, Power Query & Data Model
 How to Create a Dashboard Using Pivot Tables and Charts in Excel (Part 3)
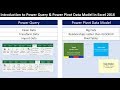 Introduction to Power Query & Power Pivot Data Model in Excel 2016 (Excel Magic Trick 1468)
 MSPTDA 04: Power Query: Import Multiple Excel Files & Combine (Append) into Proper Data Set
 Build Your Own Stock Portfolio Tracker On Google Sheets
 ☑️ Top 25 Advanced Pivot Table Tips & Tricks For Microsoft Excel
 Excel Slicers, Inside Out - includes workbook with step by step instructions
 تصميم داش بورد محترفة للموارد البشرية
 Highline Excel 2016 Class 20: Power Query Import Multiple Excel Files & PivotTable Show Values As
 Advanced Pivot table tricks for Reporting and Analysis
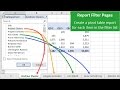 Create Multiple Pivot Table Reports with Show Report Filter Pages
 Excel Magic Trick 1357: Power Query Function to Repeat Clean & Transform Steps for Many Excel Files