How to Calculate a Correlation Matrix in SPSS
This video examines how to produce a correlation matrix on three or more variables in SPSS, including how to interpret the results.
Video Transcript: In this video we'll take a look at how to calculate a correlation matrix in SPSS. And a correlation matrix involves calculating all possible pairs of correlations. So, in this example here, notice there's 3 variables. For our correlation matrix, we'll calculate a correlation between SAT and social support, SAT and college GPA, and then finally social support and college GPA. And the way to do that is we want to go to Analyze and then Correlate and then select Bivariate. Now here we want to move our 3 variables over to the Variables box. We'll leave the default option, Pearson, selected, since we want the Pearson r correlation coefficient. We'll leave a two-tailed test selected as our default and then we'll go ahead and let SPSS flag the significant correlations. And we'll go ahead and test these correlations using an alpha of .05. Go ahead and click OK. And then here we get the output of our correlation matrix. And, as you can see here we have all of our variables SAT, social support, I'll go ahead and expand that a little bit, and college GPA in the columns then we have the same variables in the rows again. And where two variables meet or intersect, that's the bivariate correlation. Notice here on this main diagonal, we call it, these are all 1.0, or perfect correlations. Well that really shouldn't be surprising if you think about it, because this is the correlation of a variable with itself. So SAT with SAT, that's always going to be 1.0, social support with social support is 1, and college GPA with college GPA is 1. So these are always 1 on the main diagonal. What we want to look at is the off-diagonal. So either these 3 values right here in this lower triangle or these 3 values up here in the upper triangle. They're the exact same tests. So in other words, notice here we have social support and SAT, a correlation of .177. We have the exact same thing right here, SAT and social support, correlation of .177. So we'll just go and look at this lower triangle here. So notice that, as I said before, the correlation between social support and SAT is .177, college GPA and SAT is .650, and then finally social support and college GPA is .408. Now notice that these two correlations have asterisks next to them, and that this one has two asterisks and this one has one. Well if we look at the p-values here for each of these tests, which are shown under Sig., we can see that in fact the correlation between SAT and college GPA has a p-value of, it's reported as .000. What that really means is that it's less than .0005 and it's been rounded down. So this is a very small p-value, and this p-value is .015. Well notice that this p-value of .000 is less than .01, it's also less than .05. So this has two asterisks because, notice here on this note, 'correlation is significant at the .01 level,' since this p-value is less than .01, that's why we get the two asterisks here. Now for this correlation between social support and college GPA, notice the p-value here is .015. That's not less than .01, since this is .015, but it is less than .05. So it gets one asterisk, because it's less than .05, but not less than .01. Now we were testing these at .05, so we would say that SAT and college GPA, and social support and college GPA are both significant correlations. These correlations are significantly different than 0. And notice they're both positive, so higher scores on one variable are associated with higher scores on the other variable. Now social support and SAT is not significant, it had a p-value .310, and that's definitely greater than .05, so this correlation is not significant. So we cannot conclude that it's significantly different than 0. OK, so in summary, these two correlations are significant, and this one is not. And the correlation matrix calculated all these correlations at a single point in time. Now there's no limit to the number of variables you can calculate, you could have moved 10 variables over and had 45 correlations in that case. So there really is no limit all to the number of bivariate correlations you can calculate in your correlation matrix. Now we can also test if this entire matrix itself is significant. Now here I'm not talking about bivariate correlations, as we've done here, but this whole matrix at once, is it significant. And I'll do that in another video. Thanks for watching.
Видео How to Calculate a Correlation Matrix in SPSS канала Quantitative Specialists
Показать
Комментарии отсутствуют
Информация о видео
9 января 2017 г. 19:00:02
00:05:25
Другие видео канала
 Inferential Results of Pearson Correlation using SPSS
 How to make a report-ready correlation matrix quickly using SPSS and Excel
 p-values: What they are and how to interpret them
 Correlation and Regression: Concepts with Illustrative examples
 Pearson r Correlation Matrix in SPSS (easy interpretation trick!)
 Reliability test: Compute Cronbach's alpha using SPSS
 Interpret SPSS output for correlations: Pearson's r
 04 Correlation in SPSS – SPSS for Beginners
 Correlation in SPSS - P-Value
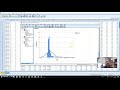 SPSS: Correlation (Pearson, Spearman, scatterplots)
 multiple correlation
 SPSS 24 Tutorial 9: Correlation between two variables
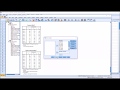 Interpreting SPSS Output for Factor Analysis
 SPSS: How to Analyse and Interpret LIKERT-SCALE Questionnaire Using SPSS
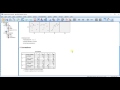 Pearson Product Moment Correlation: Part 4 - Analyzing more than two variables at once
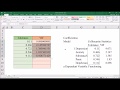 Understanding and Identifying Multicollinearity in Regression using SPSS
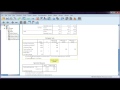 Chi-square test in SPSS + interpretation
 APA Format : Correlation Table
 Multiple Linear Regression in SPSS with Assumption Testing