Python: Estadísticas básicas, rápido y fácil (Pandas, mathplotlib)
Python tiene un módulo muy poderoso, que permite analizar los datos de una forma muy rápida y fácil, con una sola instrucción. Aquí importamos los datos desde un archivo de texto, y los representamos en una gráfica. Además te mostramos como encontrar los valores máximo, mínimo y promedio de un conjunto de datos. Aquí te mostramos cómo hacerlo paso a paso. Esperamos que este vídeo te sea de utilidad, y si tienes mejoras al programa, no olvides compartirlas en la caja de comentarios.
✔Nuestro blog:
http://cctmexico.blogspot.mx/p/python.html
✔Spyder
https://pythonhosted.org/spyder/
- - - - - - - - - - - - - - - - - - - - - - - - - - - - - - - - - - - - - - - - - - - - - - - - - - - - - - - - -
Otros vídeos que pueden ser de utilidad:
✔Python: Gráficas, Ajuste de Datos, Lectura de datos (Pandas, mathplotlib, Numpy, SciPy)
https://www.youtube.com/watch?v=yP-7Hhqngbo
✔Métodos Numéricos: Eliminación Gaussiana (Principiante)/Gaussian Elimination (Beginner)
https://www.youtube.com/watch?v=yqDq6Wl6Yoc
✔Ciclo For(def)
https://www.youtube.com/watch?v=Q-ebhAHy6Qo
✔Funciones (def)
https://www.youtube.com/watch?v=WzTzGWXtj0s
✔Entrada y salida de datos (print y raw_input)
https://www.youtube.com/watch?v=UuY-a01EQdk&index=1&list=PLgHCrivozIb0OT-K7j1o2Mry4Jmr3JO2I
✔Condiciones (If y else)
https://www.youtube.com/watch?v=GuwoiAALYv0&index=2&list=PLgHCrivozIb0OT-K7j1o2Mry4Jmr3JO2I
✔Formato de tablas (str.format)
https://www.youtube.com/watch?v=2y7IMYSqp2Q&index=5&list=PLgHCrivozIb0OT-K7j1o2Mry4Jmr3JO2I
- - - - - - - - - - - - - - - - - - - - - - - - - - - - - - - - - - - - - - - - - - - - - - - - - - - - - - - - -
✔Música
Hot Heat
Topher Mohr and Alex Elena
Believer
Silent Partner
Frequency
Silent Partner
- - - - - - - - - - - - - - - - - - - - - - - - - - - - - - - - - - - - - - - - - - - - - - - - - - - - - - - - -
Видео Python: Estadísticas básicas, rápido y fácil (Pandas, mathplotlib) канала cctmexico
Показать
Комментарии отсутствуют
Информация о видео
Другие видео канала
 Pandas en 30 minutos (Python)
 Agrupar | Clustering | SciKitLearn | KMeans |Machine Learning| Python
 3 diferencias entre 💻 R vs Python 🐍 para DATA SCIENCE
 Pandas desde cero: Estadísticas básicas para un archivo CSV (+4000 registros)
 Curso Python para Principiantes
 Pandas desde cero (Python): ¿Cómo hacer un Data frame? (Básico)
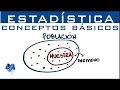 Conceptos básicos de estadística
 TODO LO QUE DEBES SABER DE ESTADÍSTICA DESCRIPTIVA EN 10 MINUTOS FACIL!
 ¿Querés predecir el futuro? Usá datos | Nicolás Loeff | TEDxMontevideo
 Python: Gráficas, Ajuste de Datos, Lectura de datos (Pandas, mathplotlib, Numpy, SciPy)
 Complete Python Pandas Data Science Tutorial! (Reading CSV/Excel files, Sorting, Filtering, Groupby)
 Aprende Python en 15 Minutos 📗
 🤖💡¿Cómo hacer que un LED prenda y apague con Arduino y Python? | Desde cero| Blinking LED
 Introducción Estadistica Inferencial con Python - PyData Guatemala
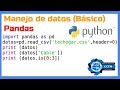 Python: Leer archivos CSV, Selección de datos, columnas y filas con Pandas (Básico)
 Regresión lineal con Python
 Gráficas de datos|DataFrame |Seaborn| Matplotlib | Pandas | Python
![Learn Python - Full Course for Beginners [Tutorial]](https://i.ytimg.com/vi/rfscVS0vtbw/default.jpg) Learn Python - Full Course for Beginners [Tutorial]
Learn Python - Full Course for Beginners [Tutorial] Cómo hacer gráficas con Python - Bytes