Creating a Graph for % Cell Viability vs Concentration using MS- Excel | PART - 2
This Tutorial is all about how to Create Percentage Cell Viability vs Concentration Graph using MS- Excel.
#Graph#Biotechnology#Research#Science
Calculating Percentage Cell Viability Using MS- Excel | PART - 1 | BIOTECHNOLOGY: https://youtu.be/Gyhfm4YgviM
Join Our Telegram Channel for free Softwares, Notes, and References books: JUST BIOTECH GEEKS: https://t.me/justbiotechgeeks
For more information and reference refer:
1. Culture of Animal Cells: A Manual of Basic Technique and Specialized Applications: https://amzn.to/2R38lUy
2. Animal Cell Culture and Technology (THE BASICS (Garland Science)) Paperback: https://amzn.to/35jz3Rk
Видео Creating a Graph for % Cell Viability vs Concentration using MS- Excel | PART - 2 канала JUST BIOTECH GEEKS
Показать
Комментарии отсутствуют
Информация о видео
Другие видео канала
 Counting Cells with a Hemocytometer
 Secrets to Building Excel Dashboards in Under 15 Minutes!
 Mtt Assay
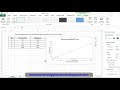 Generating Standard Curve and Determining Concentration of Unknown Sample in Excel - Simple Method
 MTT Assay for Cell Viability
 MTT Assay
 Excel Quick and Simple Charts Tutorial
 MTT assay | Cell Viability and Cytotoxicity determination using MTT assay
 Radical Scavenging Activity Measurement and IC50 Calculation DPPH Assay in Excel
 Introduction to Pivot Tables, Charts, and Dashboards in Excel (Part 1)
 t-test in Microsoft Excel
 MTT Assays: Part 3 - Analysis & Presentation
 How to plot Histogram in Origin | Mean | Fitting
 How to calculate IC50: Easy method to calculate IC50 and IC80 using Graphpad Prism
 SDS PAGE | polyacrylamide gel electrophoresis
 Dose response curves tutorial 1 (Pharmacology 1 UTS Sydney)
 Overview of OriginPro's ANOVA Tools
 Confidence intervals and error bars using MS-Excel
 How to Search & Download Research Paper from Google Scholar
 CELLULES CANCÉREUSE