Dose response curves tutorial 1 (Pharmacology 1 UTS Sydney)
This is a basic introduction to using XL to draw a dose response curve and work out the LD50
Видео Dose response curves tutorial 1 (Pharmacology 1 UTS Sydney) канала Kenneth Rodgers
Видео Dose response curves tutorial 1 (Pharmacology 1 UTS Sydney) канала Kenneth Rodgers
Показать
Комментарии отсутствуют
Информация о видео
Другие видео канала
 Radical Scavenging Activity Measurement and IC50 Calculation DPPH Assay in Excel
 How to determine Potency (EC50 value) in Prism? | Step by Step | GraphPad Prism || Dr Junaid Asghar
 Pharmacodynamics - Part 2: Dose-response Relationship
 Agonist Dose Response Curves
 Advanced Excel: Using Charts and Functions to See Trends
 Dose response curves tutorial 2 antagonists
 M3I MoDRN Toxicology Dose Response
 Excel Conditional Formatting in Depth
 Excel Basic #1 Introduction, Data Types, Formatting (Tagalog)
 Probit Analysis and LC50 Computation Using Microsoft Excel
 Next Generation Sequencing 2: Illumina NGS Sample Preparation - Eric Chow (UCSF)
 1 10 - 8. Dose Response
 MTT Assay for Cell Viability
 Curve Fitting: Origin: Dose Response Analysis
 Part 2 Insecticides Drawing dose response curves
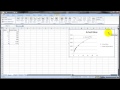 Curve Fitting with Microsoft Excel
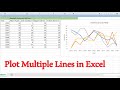 How to graph Multiple lines in 1 Excel plot | Excel in 3 Minutes
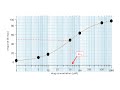 How to plot a dose response curve and measure EC50
 Multiple Regression in Excel
 How to fit non-linear equations in excel using solver