How to Analyze Bank Statements with Pivot Tables - Calculated Fields
In this video, I demonstrate how to add calculated fields or calculated columns to pivot tables so that you can analyze and summarize the debits and credits on a bank or credit card statement.
If you’d like to read the accompanying blog post on my website, you can access it here: https://www.excelcampus.com/pivot-tables/bank-statements-pivot-tables
Related Links:
5 Reasons to Use an Excel Table as the Source of a Pivot Table
https://www.excelcampus.com/tables/table-source-pivot-table/
Introduction to Pivot Tables, Charts, and Dashboards in Excel:
https://www.youtube.com/watch?v=9NUjHBNWe9M&t=66s
Refresh Pivot Table Automatically when Source Data Changes:
https://www.youtube.com/watch?v=NI1UQcYtl1A&t=107s
How to Calculate Total Daily Averages with Pivot Tables:
https://www.youtube.com/watch?v=MDZ2Ti5iEu0
#MsExcel #ExcelCampus
Видео How to Analyze Bank Statements with Pivot Tables - Calculated Fields канала Excel Campus - Jon
Показать
Комментарии отсутствуют
Информация о видео
Другие видео канала
 VLOOKUP Tutorial for Excel - Everything You Need To Know
 19 Advanced Excel Shortcuts (do you know them all?)
 How To Import & Clean Messy Accounting Data in Excel | Use Power Query to Import SAP Data
 2 Ways to Calculate Distinct Count with Pivot Tables
 How to build Interactive Excel Dashboards
 How to Analyze Survey Data Part 1 - Unpivot Data with Power Query
 Consolidate & Clean Multiple Excel Sheets in One Pivot Table
 10 Essential Shortcuts for Excel Tables
 How to use Power Pivot in Excel
 Compare Two Sheets for Duplicates with Conditional Formatting
 Setup a Slicer to Sort or Filter Another Slicer for Quick Navigation
 10 Advanced Excel Charts
 INDEX MATCH Explained (An Alternative to VLOOKUP)
 How to Combine Excel Tables or Worksheets with Power Query
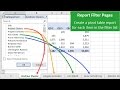 Create Multiple Pivot Table Reports with Show Report Filter Pages
 Power Query Overview - Automate Data Tasks in Excel & Power BI
 How to Fix an Excel Table that’s Slow to Scroll or Respond
 Introduction to Pivot Tables, Charts, and Dashboards in Excel (Part 1)
 How to Reconcile Accounts using Power Query