VOLUME Trading to find the BIG and Smart Traders
How to use Volume in trading to find Big and Smart Money in Stock Market and Forex Market.
Official Trading Rush Website: https://tradingrush.net
Download Official Trading Rush APP (Thanks): https://bit.ly/tradingrushapp
Support the Channel on Patreon (Thanks): https://www.patreon.com/tradingrush
Trading Merch for Best Traders: https://teespring.com/stores/trading-rush
Watch More Videos:
MACD Trading Strategy tested 100 times : https://youtu.be/nmffSjdZbWQ
Trading Strategies Tested 100 Times : https://www.youtube.com/playlist?list=PLuBdu9GKAoP4shAZd6QnM5BJUy1-IcnyD
Trading Strategies : https://www.youtube.com/playlist?list=PLuBdu9GKAoP6MEtX7stfzTGx62M5r3F4Z
Trading Tips and Mistakes : https://www.youtube.com/playlist?list=PLuBdu9GKAoP6lPl2txSXE8AlkhiwgWU2O
Download Excel Sheet for Day Trading : https://youtu.be/fLKd7uKZOvA
Subscribe For More Videos.
In my VWAP video, i talked about how and why institutional brokers trade at the VWAP line. And how you can use that information to trade when the big players are trading. Volume on a trading chart is pretty useless on its own. But if you connect the volume with the price data, you will find some of the key levels on a trading chart and can spot where the big players are trading. Individual traders with their small number of shares, can't make a huge difference on a stock or Forex pair, but if you buy and sell where the big and smart traders are trading, you will make more profit, because price tends to make a big move when the institutional buyers enter the market.
But Before we learn how to find where the big money is at, we will first have to understand how the volume actually works.
Lets say, bill buys 200 shares at 10 dollars, and bill the second sells 200 shares at 10 dollars. Since bill bought 200 shares and bill the second sold 200 shares at 10 dollars, the volume traded at 10 dollars is 200. It is not 400. A lot of new traders think that the volume is 400, since 200 plus 200 equals 400.
Purchasing few shares of a stock is very similar to purchasing few pencils from a shop. And it is very similar to the math guy from the textbooks. When the math guy pays 200 dollars to buy 200 watermelons, the sellers gives him 200 watermelons. The volume traded here is 200, since the seller sold 200 watermelons, and the buyer bought 200 watermelons at 200 dollars.
Like i said before, this kinda of volume data on its own is pretty useless on a chart, unless you also take price data into consideration.
Here's how to use the volume and price data together on a trading chart.
Number 1. When the price increases, and the volume also increases, the price is considered to be bullish.
Number 2. When the price increases, but the volume decreases, the price is considered to be bullish, but only the small traders are buying. Big players with their large amount of shares are not buying.
Number 3. When the price decreases, but the volume increases, the price is considered to be bearish.
Number 4. But when the price is decreasing and the volume is also decreasing, the price is considered to be in a downtrend, but only the small traders are selling. Big players are not participating in that move.
Now by increasing and decreasing volume, I'm not only talking about the volumes of individual candles, but also the volumes of all the neighboring candles.
A lot of new traders, will only look at the volume of the candle that they are taking the trade on, and not the volumes of other nearby candles.
Sometimes, beginner traders are told that they should pay attention to the volume when the enter trades. If you enter on a candle and its volume rises, it is a good sign, as there might be other traders entering at the same time. And if the volume does not rises, your trade entry might be wrong.
This statement is kind of misleading. When you enter trade on a candlestick pattern, there is no rule that the institutional buyers and other traders will or should take positions by looking at the same candle. So the chances of volume rising at the same time you take the position is highly unlikely. If many traders are interested in buying at the same area as you are, you will see increase in volume near your entry area, and not on your entry candle only.
Since institutional buyers trade in very high quantities, price tends to make sudden big moves, when the big players enter the market. On smaller time frames, these sudden movements can easily take out your stop loss. But if you spot the increase in volume at the right time, you should take this opportunity by taking a position. If you get lucky, you will ride the whale.
One of the situations where finding higher volume is really helpful, is during the formation of the engulfing candlestick patterns.
Subscribe for More Trading Videos.
Видео VOLUME Trading to find the BIG and Smart Traders канала TRADING RUSH
Показать
Комментарии отсутствуют
Информация о видео
Другие видео канала
 Volume Weighted Average Price Indicator LIVE Trading Strategy !!!
 5 Factors To Consider Before Taking A Trade
 Best VWAP Indicator Trading Strategy EVER!!! How to use VWAP Indicator Intraday Trading Strategy
 How to Properly Interpret Volume
 4 USEFUL Trading Breakout Tips that can Make You MONEY in TRADING
 The Only Moving Average Trading Video You Will Ever Need...
 What You Can Learn From a Stock’s Trading Volume | Technical Analysis Course
 Professional Trading with Volume. A Must See Video!
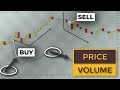 This Volume Price Action Trading Strategy Will Halve Your Losses | Swing Trade ETFS & Stocks
 The Ultimate Candlestick Patterns Trading Course
 How I Use Relative Volume to Predict Home Run Trades
 Secrets To Buying At Support (THIS IS WHAT YOU MUST KNOW...)
 Price Action Strategy TRUTH and HOW to get 70 percent WIN RATE in Trading
 Best RSI Indicator Trading Strategy - Wysetrade Method
 What Trading Volume Shows Us 👍
 How to Read Candlestick Charts
 Price & Volume Secrets खुपिया जानकारी लाखो की Technique free में
 How I got 70% Win Rate in Trading with this... Trading Strategy
 Best Part Of The MACD Indicator Trading
 Volume: How To Use When Trading📊📗