Stochastic Oscillator Strategy: The 2 Best Methods for Market Profits
Today we will cover the Stochastic Oscillator
So here’s what is on the agenda for this video: what is the Stochastic Oscillator, The utility of Range Bound Indicators, Trading Strategy for Trends, Trading Strategy for Counter Trend Trading.
Before we get into this, if you haven’t yet please hit the subscribe button, theres a lot more to come so go ahead and subscribe so that you’ll never miss an upload.
The Stochastic Oscillator is a Technical Indicator that is very commonly used to generate Overbought and Oversold Signals.
In general readings over 80 are considered overbought
and readings below 20 are considered oversold.
The indicator consists of 4 lines. The overbought and oversold lines, the slow stochastic or %K, and the fast stochastic known as $D which is simply a 3 period moving average of the %k.
Lets not make this anymore confusing. What I’m saying is that there are two lines that move on this indicator, and depending on where these two lines are, traders can determine based on recent momentum rather the current security is overbought (meaning the next move down is coming soon) or is the security is oversold (meaning the next move up is coming soon).
Range bound indicators are very useful because they have defined floors and ceiling. What this means is that the indicators cannot go below, 0 (the floor) and they cannot go above 100 (the ceiling)…..
this helps us to define and quantify rather or not a move is overbought meaning priced too high by looking at its proximity to the ceiling of 100….. But really anything over 80….. or by seeing if a move is oversold meaning it is priced to low based on its proximity to the floor of 0…. Really anything between 20 and the floor.
Other indicators can seeming go on forever in 1 directions. The price action itself for example is not range bound, so it can be difficult to look at the price along and determine if it is high or low….. well high or low relative to what? Exactly, this is why the stochastics are helpful
NOTE: Just because the stochastics hit a value of 100 or a value of 0 does not mean that the price cannot continue to go in that direction. This can and often does happen. But by combining the information from this indicator and using it with the methods I will outline next, the stochastic can give any trader an advantage.
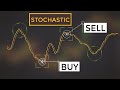
By using the indicator as a signal in the direction of the trend we can minimize false signals. Here is what I mean.
Lets use the stochastic to notate highs and lows in the price. Next we will determine the trend by determining if we are looking at a series of higher lows (uptrend) or lower highs (down trend). Once we have determined this we can then wait to trade only in the direction of the pre-determined trend.
In this example we can first determine the trend to be to the upside by looking at the series of lower highs. We now know that we are looking for a trade to the upside.
Next we will wait for the indicator to fall to an area of 20 or lower *** while to price stays higher than the previous low, indicating that we are likely to put in another higher low.
At this point we can wait on the indicator turn, or we can use the MACD to indicate an entry to the upside.
The move should be expected to last until the indicator reaches the level of 80 or higher once again.
The other way to use this indicator is by using at a counter trend indicator. Tp do this we will look for divergences. This is very similar to how we identified divergences on the MACD which was covered in a previous video which will be linked at the end of this video so go check that out next.
So here is what we are looking for in identifying a divergence on the stochastics.
First we want to identify the trend just as we did previously. Next we would look for the price to put in a new high relative to the most recent high.
Notice how this price is higher than the previous price the last time the oscillator was overbought.
Next what we want to see is that the Stochastic is not putting in a new high relative to its previous high.
In essence the indicator is disagreeing with the price. The price is putting in a new high and the indicator is unable to do so.
Then as the oscillator turns down, or the MACD gives a signal down, and the stochastic is still lower than the previous, then we have what is know as a divergence, and this can be used as a counter trend entry point.
We would then expect the trade to continue until the price reaches a level of being oversold once again.
He I hope you enjoyed the video today, if you haven’t yet hit that like button and make sure you subscribe so that you’ll never miss any of our future content.
Thank you
Видео Stochastic Oscillator Strategy: The 2 Best Methods for Market Profits канала Prophet Market
So here’s what is on the agenda for this video: what is the Stochastic Oscillator, The utility of Range Bound Indicators, Trading Strategy for Trends, Trading Strategy for Counter Trend Trading.
Before we get into this, if you haven’t yet please hit the subscribe button, theres a lot more to come so go ahead and subscribe so that you’ll never miss an upload.
The Stochastic Oscillator is a Technical Indicator that is very commonly used to generate Overbought and Oversold Signals.
In general readings over 80 are considered overbought
and readings below 20 are considered oversold.
The indicator consists of 4 lines. The overbought and oversold lines, the slow stochastic or %K, and the fast stochastic known as $D which is simply a 3 period moving average of the %k.
Lets not make this anymore confusing. What I’m saying is that there are two lines that move on this indicator, and depending on where these two lines are, traders can determine based on recent momentum rather the current security is overbought (meaning the next move down is coming soon) or is the security is oversold (meaning the next move up is coming soon).
Range bound indicators are very useful because they have defined floors and ceiling. What this means is that the indicators cannot go below, 0 (the floor) and they cannot go above 100 (the ceiling)…..
this helps us to define and quantify rather or not a move is overbought meaning priced too high by looking at its proximity to the ceiling of 100….. But really anything over 80….. or by seeing if a move is oversold meaning it is priced to low based on its proximity to the floor of 0…. Really anything between 20 and the floor.
Other indicators can seeming go on forever in 1 directions. The price action itself for example is not range bound, so it can be difficult to look at the price along and determine if it is high or low….. well high or low relative to what? Exactly, this is why the stochastics are helpful
NOTE: Just because the stochastics hit a value of 100 or a value of 0 does not mean that the price cannot continue to go in that direction. This can and often does happen. But by combining the information from this indicator and using it with the methods I will outline next, the stochastic can give any trader an advantage.
By using the indicator as a signal in the direction of the trend we can minimize false signals. Here is what I mean.
Lets use the stochastic to notate highs and lows in the price. Next we will determine the trend by determining if we are looking at a series of higher lows (uptrend) or lower highs (down trend). Once we have determined this we can then wait to trade only in the direction of the pre-determined trend.
In this example we can first determine the trend to be to the upside by looking at the series of lower highs. We now know that we are looking for a trade to the upside.
Next we will wait for the indicator to fall to an area of 20 or lower *** while to price stays higher than the previous low, indicating that we are likely to put in another higher low.
At this point we can wait on the indicator turn, or we can use the MACD to indicate an entry to the upside.
The move should be expected to last until the indicator reaches the level of 80 or higher once again.
The other way to use this indicator is by using at a counter trend indicator. Tp do this we will look for divergences. This is very similar to how we identified divergences on the MACD which was covered in a previous video which will be linked at the end of this video so go check that out next.
So here is what we are looking for in identifying a divergence on the stochastics.
First we want to identify the trend just as we did previously. Next we would look for the price to put in a new high relative to the most recent high.
Notice how this price is higher than the previous price the last time the oscillator was overbought.
Next what we want to see is that the Stochastic is not putting in a new high relative to its previous high.
In essence the indicator is disagreeing with the price. The price is putting in a new high and the indicator is unable to do so.
Then as the oscillator turns down, or the MACD gives a signal down, and the stochastic is still lower than the previous, then we have what is know as a divergence, and this can be used as a counter trend entry point.
We would then expect the trade to continue until the price reaches a level of being oversold once again.
He I hope you enjoyed the video today, if you haven’t yet hit that like button and make sure you subscribe so that you’ll never miss any of our future content.
Thank you
Видео Stochastic Oscillator Strategy: The 2 Best Methods for Market Profits канала Prophet Market
Показать
Комментарии отсутствуют
Информация о видео
Другие видео канала
 Most Effective Strategies to Trade with Stochastic Indicator (Complete Guide)
 How to Actually Trade with RSI: The real Way (Including MACD and Stochastic)
 Best VWAP Indicator Trading Strategy EVER!!! How to use VWAP Indicator Intraday Trading Strategy
 Oliver Velez | The Most Powerful Trading Tactic of All Time
 How To Master The Ichimoku Cloud (My SIMPLE Trading Guide)
 Stochastic Indicator Secrets: Trading Strategies To Profit In Bull & Bear Markets
 Accurate 5 Minute Forex Scalping Strategy | WIN RATES FOR BEGINNERS
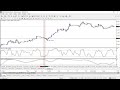 Aggressive Forex Strategy Double Stochastic Trading
 Real TIme Trades | The TRUTH about trading and Indicators
 Market Timing Strategy That Works
 MACD Indicator Strategy: The 2 BEST and Most POWERFUL Techniques Explained
 DOUBLE FOREX SCALPING STRATEGY | 200+ PIPS | Forex Trading 2020
 I risked MACD Trading Strategy 100 TIMES Here’s What Happened...
 Day Trading Indicator Set Up for Beginners 2020 (How to use VWAP, RSI, MACD Indicators)
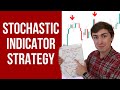 How to Trade the Stochastic Indicator like a Forex Trading PRO 📈🔥
 Turbo Trading Scalping Strategy | FAST, ACCURATE & EASY | $150 in 3 Minutes 💰🔥💰
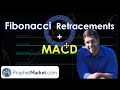 Fibonacci Retracement Strategy: AMAZING way to trade with the MACD
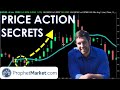 Price Action Strategy ALL Traders MUST know: Stocks, Forex, Futures and Crypto
 Use Stochastic Oscillator The Right Way
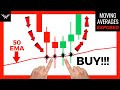 Best Moving Average Trading Strategy (MUST KNOW)