Fibonacci Retracement Strategy: AMAZING way to trade with the MACD
HINDI CCs Available
MALAY CCs Available
INDONESIAN CCs Available
FILIPINO CCs Available
GERMAN CCs Available
The Fibonacci sequence is a mathematical sequence in which every number after the first 2 is the sum of the 2 preceding ones.
0,1,1,2,3,5,8,13,21,34,55,89,144
Fibonacci’s are used as a retracement calculator in any market. The percentage of the retracement provides support and resistance areas for the current price action.
The most important of these levels is the.618 levels although the .50 area also offers a strong support area even though its not technically a Fibonacci percentage.
Drawing the the retracement lines – Fibonacci retracements are displayed by using a Fibonacci retracement tool and drawing a trend line between two recent extreme points.Once this is done a series of horizontal lines are drawn intersecting the trend line a levels between 0% and 100%
What is the Fibonacci Sequence
How to draw the Fibonacci linesFor up moves
Step one – Locate a recent extreme low
Step two – locate a recent extreme High
Step three – Connect the recent extreme low to the recent extreme High with the Fibonacci Retracement tools
For Down Moves
Step One – Locate a recent extreme Hight
Step Two – Locate a recent extreme Low
Step Three – Connect the in this order, the recent extreme high to the recent extreme low with the Fibonacci retracement tools
How to gauge price action with Fibonacci lines
Once the Fibonacci lines have been drawn pay particular attention to the .5 and .618 levels.
Steps in price action trading with fibonnacis – Up Trades
Locate a series of recent higher lows (Up trend)
Draw the Fibonacci lines on the most recent up move
Wait on the downside candles to retrace the previous move to either the .5 or the .618 area
Watch for a move to these areas but not a close below them.
Look for a Red candle followed by a Green candle that closes above the open of the red candleDown trade are extactly the opposite
How to trade the MACD with the Fibonacci Lines
Видео Fibonacci Retracement Strategy: AMAZING way to trade with the MACD канала Prophet Market
Показать
Комментарии отсутствуют
Информация о видео
Другие видео канала
 How to Actually Trade with RSI: The real Way (Including MACD and Stochastic)
 Learn to PROFITABLY Use Fibonacci Retracement levels - Fibonacci Retracements Thinkorswim
 Most Traders Will Lose Money | This Is How you Can Still Succeed.......
 Trading with Fibonacci Levels Stock Trading Strategies by Adam Khoo
 For my Subscribers....The Three Biggest Lies in Trading
 MACD Indicator Strategy: The 2 BEST and Most POWERFUL Techniques Explained
 Real TIme Trades | The TRUTH about trading and Indicators
 What is Fibonacci Retracement? How to use Fibonacci Retracement in Trading? Explained By CA Rachana
 How to Trade with Fibonacci Levels
 How To Trade With Fibonacci Retracement in Simple Way ? Nifty | Bank Nifty | By Siddharth Bhanushali
 Learn the SECRET to Trading Fibonacci Retracements
 The Only Moving Average Trading Video You Will Ever Need...
 Price Action Strategy ALL Traders MUST know: Stocks, Forex, Futures and Crypto
 Trading Trend Reversals (Divergence Trading)
 How To Use Fibonacci - Part 1
 Master The Support and Resistance Trading Strategy: ALL YOU NEED TO KNOW!
 Best RSI Indicator Trading Strategy - Wysetrade Method
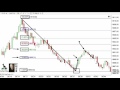 Day Trading Rules - Secret to Using Fibonacci Levels
 I risked MACD Trading Strategy 100 TIMES Here’s What Happened...
 SNIPER FOREX SCALPING STRATEGY!!! | WORKS ON US30 & XAUUSD (FIBONACCI STRATEGY 2020)