EPA Emissions in the US
Methane is the second most important greenhouse gas contributing to climate change. While emissions are substantially lower than for carbon dioxide, the biggest driver of climate change, methane is more efficient at trapping heat on a molecule by molecule basis. As a result, understanding the sources of methane and how they can be reduced, quickly, is a major effort of policymakers and environmental managers around the world.
This visualization presents gridded methane emissions across the United States for the year 2012. The gridded methane inventory is designed to be consistent with EPA’s 2016 Inventory of U.S. Greenhouse Gas Emissions and Sinks for the year 2012, which presents national totals for different source types. Gridded estimates with 0.1 degree spatial resolution are produced using a wide range of databases at the state, county, local, and point source level to allocate the spatial and temporal distribution of emissions for individual source types. Gridded inventories, developed with support from NASA’s Carbon Monitoring System, help researchers use satellite, airborne, and in situ observations to independently evaluate EPA inventories and provide recommendations on refinements that may be needed. Additional detail and dataset access are available at the EPA website.
The gridded inventory presents totals for different major methane source types. Agriculture emissions in this visualization include manure management, enteric fermentation, rice cultivation, and field burning. Waste emissions include landfills, wastewater treatment, and composting. Natural Gas emissions include emissions from production, processing, and transmission. Coal emissions include both active and abandoned coal mines.
For more details visit the SVS page: https://svs.gsfc.nasa.gov/5041
Видео EPA Emissions in the US канала NASA Scientific Visualization Studio
Показать
Комментарии отсутствуют
Информация о видео
7 июня 2023 г. 23:45:00
00:00:36
Другие видео канала
 Some Like It Hot! by Tibor Kremic
 Alex Young: Sun and Moon Together Again: Helio Science from the Moon
 A Quarter Century US Forest Disturbance History from Landsat – the NAFD-NEX Products
 Earth Day 2020: Sea Surface Temperature (SST) from January 2016 through March 2020
 Curating NASA's Extraterrestrial Samples from Past and Future Sample Return Missions
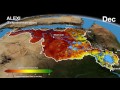 The Distributed Water Balance of the Nile Basin
 Sunny with a Chance of Space Storms by Alex Young
 Greenland's Jakobshavn Region: Simulated Ice Sheet Response Scenario RCP 8.5: 2008 - 2300
 Paula Bontempi: An Overview of Earth Science at NASA
 AGU 2023 Tuesday Introductory Remarks from AGU & NASA
 Anna Barth: Listening to Eruption Dynamics at Lone Star Gyser, Using Multivariate Sonification
 Arctic Sea Ice Minimum 2022.
 From Slime to Solutions: Monitoring water quality and cyanobacteria from space
 Explore the Literature in the New ADS
 Future of infectious diseases: How Earth observations can help predict next pandemics?
 IceFlow: Harmonizing NASA ICESat, IceBridge, and ICESat-2 data
 EXPORTS
 Jakobshavn Regional View of Simulated Greenland Ice Sheet Response Scenario - RCP 2.6: 2008 - 2300
 Warning! Local Tsunami Alert from GPS Array by Dara Goldberg
 Antarctic Bedrock
 The Connected Solar System SSTP