How to use Williams Fractal Strategy ?
Fractal is an interesting indicator that is very popular among new traders.
Download Official Trading Rush APP (Thanks): https://bit.ly/tradingrushapp
Support the Channel on Patreon (Thanks): https://www.patreon.com/tradingrush
Trading Merch for Best Traders: https://teespring.com/stores/trading-rush
MACD Trading Strategy tested 100 times : https://youtu.be/nmffSjdZbWQ
Trading Strategies Tested 100 Times : https://www.youtube.com/playlist?list=PLuBdu9GKAoP4shAZd6QnM5BJUy1-IcnyD
Trading Strategies : https://www.youtube.com/playlist?list=PLuBdu9GKAoP6MEtX7stfzTGx62M5r3F4Z
Trading Tips and Mistakes : https://www.youtube.com/playlist?list=PLuBdu9GKAoP6lPl2txSXE8AlkhiwgWU2O
Download Excel Sheet for Day Trading : https://youtu.be/fLKd7uKZOvA
Subscribe For More Videos.
Why wouldn't it, after all this fractal indicator tries to show the important price levels on a Trading Chart. This indicator is created by Bill Williams. That's right. The same person who also created the famous alligator indicator. When I tested the alligator indicator 100 times in my previous video, to show it's real win rate, we saw it was a good indicator that made money in the end. So lets see if fractal trading strategy is good as well.
On Trading View, this is what the Fractal Indicator looks like. Once you add it on your chart, you will see some arrow above and below the candles. On most trading platforms, These arrows are usually red and green in color. Green Arrows will only appear above the candle, and red arrows will only appear below the candles. Also, the arrow that form below the candles, are always pointing in the downward direction, and arrow that form above the candles, are always pointing in the upwards direction.
According to the fractal indicator, When a red arrow appears below the candle, the candle and low that the candle has created, can be an important price level. In simple words, the low of the candle could be a potential support.
Similarly, when a green arrow appears above the candles, the candle and the high that the candle has created, can be an important level. In simple words, high of the candle could be a potential resistance.
But, why are only some of the levels are considered important by the fractal indicator? Why the arrow doesn't appear above other candles. Well, to answer that question, we will first have to understand how fractal indicator works.
The green fractal arrow will only appear, when there are two candles with a lower high on each side of it.
Here's an example. Here you can see, the green arrow appeared, when the two candles on each side of it, had a lower high.
Similarly, the red fractal arrow will only appear, when there are two candles with a higher low on each side of it. Here's an example. Here you can see, the red arrow appeared, when the two candles on each side of it, had a higher low.
First of all, lets see the basic Fractal Trading Strategy, then I will show you a way to filter false signals given by the fractal indicator, by using another indicator that is also created by Bill Williams.
Видео How to use Williams Fractal Strategy ? канала TRADING RUSH
Показать
Комментарии отсутствуют
Информация о видео
Другие видео канала
 BEST William's Alligator Strategy for Daytrading Forex
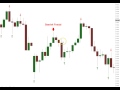 What are Fractals?
 The Practical Fractal: The Holy Grail to Trading by Bill Williams PhD of Profitunity Trading Group
 FRACTAL INDICATOR, 99% Winning Strategy, Iq Option 2020, TRY TO BELIEVE!!
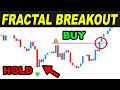 I tested FRACTAL Breakout Trading Strategy 100 TIMES and then this happened...
 Learn To Trade Ichimoku & Fractals With Lifetime Membership Offer!
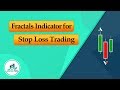 How to Use Fractals Indicator MT4 for Stop Loss Trading?
 "FRACTAL MAGIC" 100% TRADE WITHOUT LOSS || GUARANTEED !
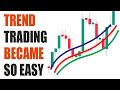 The Good way to use Williams Alligator Indicator ?
 5 Simple Steps Complete Trading Strategy that PRO Traders Know but Beginners Ignore...
 How To Day Trade Using Fractals - Market Turns, Breakouts and Draw Trend Lines Using Fractals.
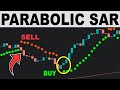 Parabolic SAR - Simple But Effective Trading Strategy
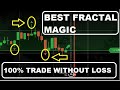 BEST FRACTAL MAGIC 100% TRADE WITHOUT LOSS || BINARY OPTION STRATEGY 2020
 How To Master The Ichimoku Cloud (My SIMPLE Trading Guide)
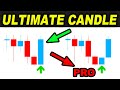 Ultimate Candlestick Patterns Trading Secrets that no one tells you
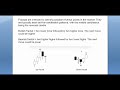 Fractals Indicator Explained
 Best RSI Indicator Trading Strategy - Wysetrade Method
 Live Trading Forex Strategy EVER!!! Made +175 $ in 4 MINUTES on Intraday Trade
 Top 5 BEST Trading Strategies that work with PROOF