Parabolic SAR - Simple But Effective Trading Strategy - Forex Day Trading
Parabolic sar is an interesting indicator that is very popular among traders.
Download Official Trading Rush APP (Thanks): https://bit.ly/tradingrushapp
Support the Channel on Patreon (Thanks): https://www.patreon.com/tradingrush
Trading Merch for Best Traders: https://teespring.com/stores/trading-rush
MACD Trading Strategy tested 100 times : https://youtu.be/nmffSjdZbWQ
Trading Strategies Tested 100 Times : https://www.youtube.com/playlist?list=PLuBdu9GKAoP4shAZd6QnM5BJUy1-IcnyD
Trading Strategies : https://www.youtube.com/playlist?list=PLuBdu9GKAoP6MEtX7stfzTGx62M5r3F4Z
Trading Tips and Mistakes : https://www.youtube.com/playlist?list=PLuBdu9GKAoP6lPl2txSXE8AlkhiwgWU2O
Download Excel Sheet for Day Trading : https://youtu.be/fLKd7uKZOvA
Subscribe For More Videos.
It was made by J. Welles Wilder Jr, and it is used to find the direction of a trend. Furthermore, you can also use it as an entry signal generator, or as a trailing stop loss indicator. That's right, you can also use it as an exit signal generator. This is one of those rare indicators like Ichimoku Cloud, that tries to show different kinds of information on it's own.
First of all, lets see the basic Parabolic sar Trading Strategy, then I will show you a way to filter the false signals given by the Parabolic sar indicator.
So, here's how the Parabolic sar indicator is used by many traders.
When the Parabolic sar dot is below the candles, the market is considered to be in an uptrend. You can enter a long position, when the dot is placed below the candle for the first time.
Similarly, When the Parabolic sar dots are above the candles, the market is considered to be in a downtrend. And you can enter a short position, when the dot is placed above the candle for the first time.
Remember, Parabolic sar is a lagging indicator. Therefore, you should wait for the entry candle to be completed. Then and only then, you should consider taking the trade at the closing price of the candle.
Here's an example. The dots flipped below the candle. In this long setup, We could have entered a long position, when the dot appeared below the candle for the first time.
Here's a short example. The dots flipped above the candle. We could have entered a short position, when the dot appeared above the candle for the first time.
Like and Share the Video to see More Stock Market Intraday Trading Strategy and Forex Day Trading Strategies
Видео Parabolic SAR - Simple But Effective Trading Strategy - Forex Day Trading канала TRADING RUSH
Показать
Комментарии отсутствуют
Информация о видео
Другие видео канала
 Trading With Parabolic SAR Like a PRO (Forex Trading Strategy With PSAR & Ichimoku Cloud)
 70% Win Rate Highly Profitable MACD + Parabolic SAR + 200 EMA Trading Strategy (Proven 100 Trades)
 Parabolic Sar Indicator - Settings, Strategies and Tips
 How I got 70% Win Rate in Trading with this... Trading Strategy - Forex Day Trading
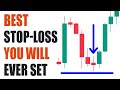 ATR Trading Strategy - The Best Stop Loss Indicator Out There ! - Forex Day Trading
 Heikin Ashi - Best For Beginner Day Traders ? - Forex Day Trading
 The Only Moving Average Trading Video You Will Ever Need...
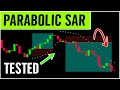 Parabolic SAR - Best Easy Forex Scalping Strategy TESTED with $100 - Small Premium Trading Strategy
 Parabolic SAR - Yeah, No. But Maybe.
 Highly Profitable Day Trading Strategy: Heikin Ashi + Parabolic Sar + EMA
 BEST William's Fractal Indicator Strategy for Daytrading Stocks & Forex
 Best RSI Indicator Trading Strategy - Wysetrade Method
 How To Use Parabolic SAR Indicator Strategy Effectively in Trading
 How To Master The Ichimoku Cloud (My SIMPLE Trading Guide)
 PARABOLIC SAR Indicator Best, Simple and Effective Crypto Trading Strategy Explained!
 Top 5 BEST Trading Strategies that work with PROOF - Forex Day Trading
 🔴 EMA-Heiken Ashi | This is The Trading Strategy The Top 5% Use (and it makes trading way too EASY!)
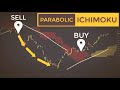
 TRADED ICHIMOKU + PARABOLIC SAR 100 TIMES (Revealing Profits)
 MACD + Parabolic SAR Trading Strategy - VERY PROFITABLE for day trading, swing trading and scalping