Using MySQL to Create a Grafana Dashboard
Subscribe to Support the channel: https://youtube.com/c/vikasjha001?sub_confirmation=1
Need help? Message me on LinkedIn: https://www.linkedin.com/in/vikasjha001/
Want to connect on Instagram? Here is my id @vikasjha001 ✔️ Join Grafana Group on Telegram to ask any questions:
https://t.me/GrafanaGlobal
Connect to me:
💥 LinkedIn
https://www.linkedin.com/in/vikas-kumar-jha-739639121/
📷 Instagram
https://www.instagram.com/vikasjha001/
✈️ Channel
https://www.youtube.com/lifebeyondwork001
Do subscribe for more tutorials.
www.youtube.com/c/vikasjha001?sub_confirmation=1
============================================
Get complete latest Grafana Course on Udemy which teaches below topics:
✔️udemy: www.itpanther.com/grafana
Here is what you will learn in the course:
📘 Grafana Introduction
📘 Grafana Overview and Overall Architecture
📘 Installing Grafana on a Linux Server
📘 Installing Grafana on Windows
📘 Starting, Stopping Grafana Services on Windows
📘 Installing Grafana on Docker
📘 Creating Grafana Dashboards
📘 Grafana User Interface Overview
📘 Installing and Managing InfluxDB Services
📘 Installing and Managing Telegraf Services
📘 Grafana Dashboard - Server Health Summary Dashboard
📘 Graph Panel - CPU & Memory Utilization
📘 Graph Panel - Multiple Servers & Problem Statement to use Grafana Variables
📘 Custom Variable - Static Variable Values
📘 Query Variable - Dynamic Variable Values
📘 Dependent Varialbes - Cascaded Variables
📘 Dependent Variables - Udemy.mp4
📘 Automatic Repeat Panel Based on Variable Value
📘 Organizing Panels and Dashboards for Easy Management
📘 Repeat Row to Create Dynamic Grafana "Summary Dashboard"
📘 Fixing Y Axis' Minimum and Maximum Value in Graph Panel
📘 Creating Thresholds in Graph Visualizations
📘 Python Program to Increase Memory Utilization for Testing Purpose
📘 Creating Thresholds in Graph Visualization and StatsD Graphs
📘 Advance Tabular Visualization With Gauge in one column
📘 Advance Stat Visualization in Grafana 7
📘 Exploring More Visualization Properties - Legends, Axis, Series Override
📘 Creating Grafana Dashboard Using MySQL As Data Source
📘 Using Custom SQL Query to Create Dashboard
📘 Monitoring Websites and Docker Services
📘 Monitoring Websites or URL Using Grafana
📘 Monitor Docker Services
📘 Installing Plugins
📘 Installing Plugins and Creating Pie Chart Visualization
📘 Creating Alerts and Annotation in Dashboards in Grafana
📘 Grafana Email Alerts Configuration
📘 Grafana and Telegram Integration and Alerts Configuration
📘 Users and Roles Creation and Management in Grafana
📘 User and Roles Creation in Grafana
📘 Embedding Grafana Panel on Any Website
📘 Embedding Grafana Panel in any HTML Page (Website)
📘 Upgrading Grafana From Version 6 to Version 7 (Latest Version)
📘 Optional - Upgrade Grafana From Version 6 to Version 7
📘 Optional - Changing Grafana Database to MySQL
✔️ Join Grafana Group on Telegram to ask any questions:
https://t.me/GrafanaGlobal
✔️ Connect to me:
💥 LinkedIn
https://www.linkedin.com/in/vikas-kumar-jha-739639121/
📷 Instagram
https://www.instagram.com/vikasjha001/
✈️ Channel
https://www.youtube.com/lifebeyondwork001
Do subscribe for more tutorials.
www.youtube.com/c/vikasjha001?sub_confirmation=1
============================================
#LearnGrafanaByVikasJha #Grafana #VikasJha
Видео Using MySQL to Create a Grafana Dashboard канала Vikas Jha - An Indian Techy
Need help? Message me on LinkedIn: https://www.linkedin.com/in/vikasjha001/
Want to connect on Instagram? Here is my id @vikasjha001 ✔️ Join Grafana Group on Telegram to ask any questions:
https://t.me/GrafanaGlobal
Connect to me:
https://www.linkedin.com/in/vikas-kumar-jha-739639121/
https://www.instagram.com/vikasjha001/
✈️ Channel
https://www.youtube.com/lifebeyondwork001
Do subscribe for more tutorials.
www.youtube.com/c/vikasjha001?sub_confirmation=1
============================================
Get complete latest Grafana Course on Udemy which teaches below topics:
✔️udemy: www.itpanther.com/grafana
Here is what you will learn in the course:
📘 Grafana Introduction
📘 Grafana Overview and Overall Architecture
📘 Installing Grafana on a Linux Server
📘 Installing Grafana on Windows
📘 Starting, Stopping Grafana Services on Windows
📘 Installing Grafana on Docker
📘 Creating Grafana Dashboards
📘 Grafana User Interface Overview
📘 Installing and Managing InfluxDB Services
📘 Installing and Managing Telegraf Services
📘 Grafana Dashboard - Server Health Summary Dashboard
📘 Graph Panel - CPU & Memory Utilization
📘 Graph Panel - Multiple Servers & Problem Statement to use Grafana Variables
📘 Custom Variable - Static Variable Values
📘 Query Variable - Dynamic Variable Values
📘 Dependent Varialbes - Cascaded Variables
📘 Dependent Variables - Udemy.mp4
📘 Automatic Repeat Panel Based on Variable Value
📘 Organizing Panels and Dashboards for Easy Management
📘 Repeat Row to Create Dynamic Grafana "Summary Dashboard"
📘 Fixing Y Axis' Minimum and Maximum Value in Graph Panel
📘 Creating Thresholds in Graph Visualizations
📘 Python Program to Increase Memory Utilization for Testing Purpose
📘 Creating Thresholds in Graph Visualization and StatsD Graphs
📘 Advance Tabular Visualization With Gauge in one column
📘 Advance Stat Visualization in Grafana 7
📘 Exploring More Visualization Properties - Legends, Axis, Series Override
📘 Creating Grafana Dashboard Using MySQL As Data Source
📘 Using Custom SQL Query to Create Dashboard
📘 Monitoring Websites and Docker Services
📘 Monitoring Websites or URL Using Grafana
📘 Monitor Docker Services
📘 Installing Plugins
📘 Installing Plugins and Creating Pie Chart Visualization
📘 Creating Alerts and Annotation in Dashboards in Grafana
📘 Grafana Email Alerts Configuration
📘 Grafana and Telegram Integration and Alerts Configuration
📘 Users and Roles Creation and Management in Grafana
📘 User and Roles Creation in Grafana
📘 Embedding Grafana Panel on Any Website
📘 Embedding Grafana Panel in any HTML Page (Website)
📘 Upgrading Grafana From Version 6 to Version 7 (Latest Version)
📘 Optional - Upgrade Grafana From Version 6 to Version 7
📘 Optional - Changing Grafana Database to MySQL
✔️ Join Grafana Group on Telegram to ask any questions:
https://t.me/GrafanaGlobal
✔️ Connect to me:
https://www.linkedin.com/in/vikas-kumar-jha-739639121/
https://www.instagram.com/vikasjha001/
✈️ Channel
https://www.youtube.com/lifebeyondwork001
Do subscribe for more tutorials.
www.youtube.com/c/vikasjha001?sub_confirmation=1
============================================
#LearnGrafanaByVikasJha #Grafana #VikasJha
Видео Using MySQL to Create a Grafana Dashboard канала Vikas Jha - An Indian Techy
Показать
Комментарии отсутствуют
Информация о видео
19 сентября 2020 г. 20:08:21
00:27:21
Другие видео канала
 Grafana Course for Beginners | Learn Grafana | Grafana Tutorials
 Grafana Dashboard with JSON APIs. visualize JSON, CSV, Graphql, XML in grafana
 Custom MySQL Time Series Queries in Grafana 6
 Using Mysql custom query to create Grafana dashboards
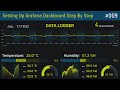 How To Setup A Grafana Dashboard Step By Step
 Grafana Variables and Templates with Prometheus 📊 | Introduction
 Business Dashboards with Grafana and MySQL
 Grafana cloudwatch | Dynamic dashboard creation with variables
 #255 Node-Red, InfluxDB, and Grafana Tutorial on a Raspberry Pi
 How to Setup a Grafana Dashboard Step-by-Step Using GoogleSheet as Datasource
 Home automation dashboard tutorial using Home Assistant, InfluxdB and Grafana
 Grafana Dashboard📊: Monitor CPU, Memory, Disk and Network Traffic Using Prometheus and Node Exporter
 Grafana : Dashboard Variables
 S1E9 - MS SQL and Grafana Dashboards
 Grafana Tutorial For Beginners | Continuous Monitoring With Grafana | DevOps Training | Edureka
 Dashboards using Grafana - MYSQL, Prometheus, Windows node exporter
 Grafana configuration with AWS RDS MySQL database | MySQL external database configuration
 Flux query language and Influxdb basics
 Guide to Grafana 101: Getting started with (awesome) visualizations