How To Draw a Simple Floor Plan in Visio
In this tutorial you will learn how to create floor plan using Microsoft Visio: SUBSCRIBE!!! http://howtoanalyzedata.net/youtube
Download Visio Files: https://www.howtoanalyzedata.net/resources/
Microsoft Visio is software for drawing diagrams. These include floor plans, electrical diagrams, flowcharts, org charts, building plans, floor plans, data flow diagrams, process flow diagrams, business process modeling, swim lane diagrams, 3D maps, and many more.
If appropriate for your needs, Visio can produce extremely helpful, slick, useful diagrams of all types, and these can provide the professional look you want for presentations, reports, audits, building plans, floor plans, documentation, and modeling better ways to do things. Visio includes a big library of shapes/symbols used in dozens of diagram types. These symbols represent specialized pieces of diagrams such as process flow diagrams, business process modeling, data flow diagrams, and many more. These are used widely in various fields for various purposes.
Microsoft Visio can be used in all below settings and more:
In Architecture: Create Floor plans, plumbing and electrical diagrams
In any field: A flowchart, which can take various forms, can be used to document and analyze a process; standardize a process for efficiency and quality; communicate a process for training or understanding by other parts of the organization; and identify bottlenecks, redundancies and unnecessary steps in a process and improve it.
In software engineering and business analysis: Data flow diagrams (DFDs) can provide a focused approach to technical development, in which more research is done upfront to get to coding. Business analysts use DFDs to analyze existing systems and find efficiencies. Diagramming the process can uncover steps that might otherwise be missed or not fully understood.
In business: Business Process Modeling and Notation (BPMN) is targeted at participants and other stakeholders in a business process to gain understanding through an easy-to-understand visual representation of the steps. At a more involved level, it’s targeted at the people who will implement the process, giving sufficient detail to enable precise implementation
In chemical engineering or process engineering: A Process Flow Diagram (PFD) is a type of flowchart that illustrates the relationships between major components at an industrial plant. Diagrams can serve to document, analyze, audit, or model a better way.
If you would like to learn more about Visio make sure to check out below training courses:
Master Microsoft Visio the Easy Way: http://www.howtoanalyzedata.net/master-microsoft-visio-the-easy-way
Visio 2013/2016/365 - Like a Boss. The Definitive Course: https://www.howtoanalyzedata.net/visio-like-a-boss-online-training-course
------------------------------------------
My other YouTube Tutorials: https://www.howtoanalyzedata.net/youtube-tutorials/
------------------------------------------
Online Training Courses to succeed on any level: https://www.howtoanalyzedata.net/online-training/
LET'S CONNECT!!!!!
Thanks for all your support. Good luck on your projects!!! Please Subscribe and stay in touch to share your successes!!!
• Online Training for Everyone (Web Site): https://www.howtoanalyzedata.net
• YouTube: https://www.howtoanalyzedata.net/youtube
• Email: https://www.howtoanalyzedata.net/email
• Twitter: https://www.howtoanalyzedata.net/twitter
• Facebook: http://www.howtoanalyzedata.net/facebook
Видео How To Draw a Simple Floor Plan in Visio канала Online Training for Everyone
Показать
Комментарии отсутствуют
Информация о видео
21 июля 2018 г. 19:02:57
00:08:37
Другие видео канала
 Microsoft Visio Tutorial For Beginners - Get Started with Shapes and Connectors
 Creating Floor Plans from Images in SketchUp - The SketchUp Essentials #23
 How to Pass LinkedIn Excel Test: 10 Most Unusual LinkedIn Excel Test Questions
 How to Make a Floorplan in Excel : Microsoft Excel Tips
 Visio 2016 Training Course
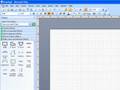 Microsoft Visio - Scale drawing Part 1
 How to Position Shapes in Visio 2016 Using Rulers, Grids and Guides
 Simple Floorplan in Visio 2013
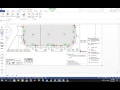 How to use to scale drawings in Visio
 How Calculate Square Footage of a House in Visio
 Visio Tutorial
 Small Home design Plan 6.5x8.5m with 2 Bedrooms
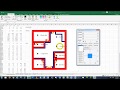 3 Ways to Draw and Create a Floorplan In EXCEL like CAD with Examples!
 How To Draw a Basement Plan
 Visio Tips and Tricks - How to use Microsoft Visio to Create Diagrams, Rooms,and Organization Charts
 The Beginner's Guide to Visio - Visio Basics Tutorial
 SketchUp Interior Design Tutorial — How to Create a Floor Plan (in 7 EASY Steps)
 Microsoft Visio Tutorial
 Visio 2010 Dimensioning Tutorial