R - Graphs - Line Graphs with Error Bars in Ggplot2
Recorded: Fall 2015
Lecturer: Dr. Erin M. Buchanan
This video covers the basic ideas of functions using R - topics include:
- ggplot2
- line graphs with one independent variable
- line graphs with two independent variables
- error bars
- stat summary
- changing the legends, axes labels, and group labels
Lecture materials and assignment available at statisticsofdoom.com.
https://statisticsofdoom.com/page/graduate-statistics/
Used in the following courses: Graduate Statistics
Видео R - Graphs - Line Graphs with Error Bars in Ggplot2 канала Statistics of DOOM
Показать
Комментарии отсутствуют
Информация о видео
Другие видео канала
 R - Graphs - Bar Charts with Error Bars in Ggplot2
 R Tutorial | Creating and enhancing line chart in ggplot | R Programming
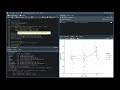 How to perform a Two Way ANOVA in R
 Another Method to Creating and Editing Interaction Plots in R Studio
 Introduction to ggplot in R
 How To Analyze Data In RStudio? Six Bachelor Level Analysis Methods Quickly Demonstrated.
 How to Make a Line Plot in R
 Make Beautiful Graphs in R: 5 Quick Ways to Improve ggplot2 Graphs
![[R Beginners] Plot and customise boxplot using GGPLOT in R . Code included](https://i.ytimg.com/vi/48b4BzxHHH8/default.jpg) [R Beginners] Plot and customise boxplot using GGPLOT in R . Code included
[R Beginners] Plot and customise boxplot using GGPLOT in R . Code included Barplot in R (8 Examples) | How to Create Barchart & Bargraph in RStudio | Stacked, Grouped & Legend
 Reading CSV files in R Language and Plotting Line Graphs - Data Analytics Tutorial
 Fitting Poisson and zero-inflated Poisson models
 How to draw a line graph using ggplot with R programming. Plots and graphs to visualize data.
 Nonlinear curve fitting in R using mosaic and nls
 Create Simple Graphs in R Studio | R Beginners Graphs Tutorial | Bar Plot | Scattered | Box Plot
 Barplot using R with error bar, Data Visualization, GGplot2, Plotting data ranking
 Scatter plot and Line plot in R (using ggplot2)
 R - Graphs - Ggplot2 Intro + Histogram
 Draw Multiple Variables as Lines to Same ggplot2 Plot in R (2 Examples) | geom_line & reshape2 melt