Create Simple Graphs in R Studio | R Beginners Graphs Tutorial | Bar Plot | Scattered | Box Plot
In this second video of the R Beginner tutorial, I will show you how to create various plots such as bar graph, scattered plot, pie chart, box plot etc., using simple R functions.
to install excel library
install.packages("readxl")
Facebook Group: https://www.facebook.com/groups/261045198486665
Instagram Page: https://www.instagram.com/bioinformatics.bb/
Видео Create Simple Graphs in R Studio | R Beginners Graphs Tutorial | Bar Plot | Scattered | Box Plot канала Bioinformatics With BB
Показать
Комментарии отсутствуют
Информация о видео
25 сентября 2020 г. 16:38:39
00:28:41
Другие видео канала
 An introduction to the R programming language for Bioinformatics students - Part 1/2
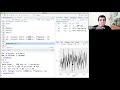 Econometrics - Estimating VAR model in R
 Introduction to ggplot in R
 Build Impressive Charts: It's NOT your usual Bar Chart (Infographics in Excel)
 Introduction to R for Biologists | Run a Simple Program Complementary DNA
 R Programming for Beginners | Complete Tutorial | R & RStudio
 How to import data from excel into R studio. R programming for beginners
 Make Beautiful Graphs in R: 5 Quick Ways to Improve ggplot2 Graphs
 Creating bar graph on R
 RStudio Introduction to Simple X-Y Plots
 Importing a .csv file to R Studio using the read.csv function
 Tutorial 11-Barplot using R with error bar, Data Visualization, GGplot2, Plotting data ranking
 Customize Bar plot in R -GGplot2- in 5 steps : Beautiful publication ready bar plot
 How to draw a line graph using ggplot with R programming. Plots and graphs to visualize data.
 Boxplots in R
 Introduction to Plotting in R
 Bar Charts and Pie Charts in R | R Tutorial 2.1 | MarinStatsLectures
 R Programming Tutorial - Learn the Basics of Statistical Computing
 Bar Charts using ggplot geom_bar - R Lesson 16
 Create a boxplot using R programming with the ggplot package.