Learn Basic statistics for Business Analytics
Business Analytics and Data Science are almost same concept. For both we need to learn Statistics. In this video I tried to create value on most used statistical methods for Data Science or Business Analytics for Statistical model Building.
Statistics is the study of the collection, analysis, interpretation, presentation, and organization of data. In applying statistics any can handle a scientific, industrial, or societal problem. I value your time and effort that is why I have capture almost 20 statically concept in this video.
Learn Basic statistics for Business Analytics
Here I have capture how to learn Mean, how to learn Mode, How to learn median, Concept of Sleekness, Concept of Kurtosis, learn Variables, concept of Standard deviation, Concept of Covariance, Concept of correlation, Concept of regression, How to read regression formula, how to read regression graph, Concept of Intercept, Concept of slope coefficient, Concept of Random Error, Different types of regression Analysis, Concept ANOVA (Analysis of Variance), How to read ANOVA table, How to learn R square (Interpreted R square), Concept of Adjusted R Square, Concept of F test, Concept of Information Value, Concept of WOE, Concept of Variable inflation Factors.
Learn Basic statistics for Business Analytics
By this video you can Start Learn statistics for Data Science and Business analytics easily and effectively.
These statistics are useful when at the time of running linear regression, Logistic regression statistics models.
For Statistical Data Exploration you may need to see Meager of central tendency and Data Spread in Statistics. By Understanding Mean, Mode, Median, Sleekness, Kurtosis, Variance, Standard deviation.
Learn Basic statistics for Business Analytics
To understand statistical relationship between variables you can use Covariance, Correlation coefficient, Regression , ANOVA (Analysis of Variance) .
Learn Basic statistics for Business Analytics
To understand Strength of stastical relationship between variables you can use R square, Adjusted R square, F test.
If you want to understand variable importance in your stastical model you can use Information value (IV) and Weight of evidence (WOE) Concept. Information value and Weight of evidence mostly used in Logistic Regression Analysis.
Learn Basic statistics for Business Analytics
Variable inflation factors (VIF) is used for understanding, It is the stastical method to understand variable importance. What is the importance of this variable statically in the Regression model? By VIF we check Correlation between variable.
Learn Basic statistics for Business Analytics
At last I have explained when to use ANOVA, When to Use Linear regression and when to use Logistic regression.
Learn Basic statistics for Business Analytics
Thank you So much for watching this video, Hope I can add some value in your Journey as a Statistician, Business Analytics professional and Data Scientist professional.
Blogger :
http://koustav.analyticsanalysis.busi...
google plus:
https://plus.google.com/u/0/115750715
facebook link:
https://www.facebook.com/koustav.biswas.31945?ref=bookmarks
website:
https://www.analyticsanalysisbusiness.com
#BasicStatistics #BasicStaatisticsforAnalytics
Видео Learn Basic statistics for Business Analytics канала Analytics Analysis Business
Показать
Комментарии отсутствуют
Информация о видео
21 сентября 2017 г. 8:39:37
00:17:59
Другие видео канала
 Statistics made easy ! ! ! Learn about the t-test, the chi square test, the p value and more
 Teach me STATISTICS in half an hour!
 Business Analytics with Excel | Data Science Tutorial | Simplilearn
 Introduction to Business Analytics (2020 Edition)
 Statistics For Data Science | Data Science Tutorial | Simplilearn
 Mean, median and mode of grouped Data(Lesson 1)
 Statistics Interview Questions | Statistics Interview Questions and Answers | Intellipaat
 Business Analyst Full Course In 2 Hours | Business Analyst Training For Beginners | Simplilearn
 Statistics full Course for Beginner | Statistics for Data Science
 Statistics And Probability Tutorial | Statistics And Probability for Data Science | Edureka
 What is Skewness? | Statistics | Don't Memorise
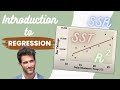 What is Regression? | SSE, SSR, SST | R-squared | Errors (ε vs. e)
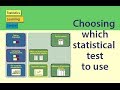 Statistical Tests: Choosing which statistical test to use
 1. Introduction to Statistics
 Correlation and Regression Analysis: Simplest Way To Learn With Examples | Diffrence
 Statistics intro: Mean, median, and mode | Data and statistics | 6th grade | Khan Academy
 Intro to Hypothesis Testing in Statistics - Hypothesis Testing Statistics Problems & Examples
 Statistics for Data Science | Probability and Statistics | Statistics Tutorial | Ph.D. (Stanford)
 Statistics - A Full University Course on Data Science Basics
 Introduction to Statistics