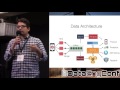
Rohit Gupta – Logging at scale using Graylog - Billion+ messages, 100K req/sec
Slides: https://www.rohit.io/res/talks/logging-at-scale-using-graylog-billion-messages-100k-req-sec/
With the advent of micro-services, dozens of releases per day, logs are the bread and butter for a successful real-time technology platform like OlaCabs. In this talk, I would be presenting our logging pipeline and the challenges we faced while doing it at Ola scale.
Видео Rohit Gupta – Logging at scale using Graylog - Billion+ messages, 100K req/sec канала Hasgeek TV
Показать
Комментарии отсутствуют
Информация о видео
Другие видео канала
 Scalable and Reliable Logging at Pinterest (DataEngConf SF16)
 GeeCON 2017: Piotr Przybył - Graylog: one tool to log 'em all
 Open Source Logging: Getting Started with Graylog Tutorial
 3. Apache Kafka Fundamentals | Apache Kafka® Fundamentals
 Grafana vs Kibana | Beautiful data graphs and log analysis systems
 Logging with EFK in Kubernetes
 Sulekhan 2021: Celebrating Indian Calligraphy
 Anton Lavrik - A Reflection on Building the WhatsApp Server - Code BEAM 2018
 JSON Extractor
 NLog and Splunk in Docker for .NET Core Application
 14. Graylog 3.0 Grok Patterns, Extractors and Pipelines || part 3
 09. Sending syslog messages from ASA and Linux to Graylog 3.0
 11. Graylog 3.0 Streams and Indices
 Graylog, Open Source Log Management
 Introduction to Fluentd: Collect logs and send almost anywhere
 Setting up Prometheus and Grafana for monitoring your servers
 13. Graylog 3.0 Grok Patterns, Extractors and Pipelines || part 2
 monitoring with Prometheus and Grafana - a quick introduction
 Apache Kafka in 5 minutes