Setting up Prometheus and Grafana for monitoring your servers
Prometheus is an open source monitoring solution that is super easy to setup.
Grafana makes displaying your metrics and data a piece of cake.
https://prometheus.io/
https://grafana.com/
Video turned out a bit longer than I planned but I wanted to ship something instead of spinning on it. Let me know your thoughts and what else you'd like to see!
Видео Setting up Prometheus and Grafana for monitoring your servers канала Eddie Zaneski
Показать
Комментарии отсутствуют
Информация о видео
Другие видео канала
 Monitoring, the Prometheus Way
 How to monitoring linux server with prometheus and grafana | DevOps Grafana and Prometheus Demo
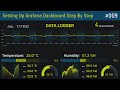 How To Setup A Grafana Dashboard Step By Step
 Introduction to Microservices, Docker, and Kubernetes
 Prometheus Monitoring for Java Web Applications w o Modifying Source Code by Fabian Stäber
 Grafana/Prometheus/WMI Exporter - Windows Server Monitoring - Part01
 Guide to Grafana 101: Getting Started with (awesome) Visualizations
 Prometheus Monitoring for Java Developers by Fabian Stäber
 Grafana Loki: Like Prometheus, But for logs. - Tom Wilkie, Grafana Labs
 Spring Boot - Monitoring Microservice with Prometheus and Grafana | Java Techie
 What is Helm in Kubernetes? Helm and Helm Charts explained | Kubernetes Tutorial 23
![[ Kube 26 ] Prometheus monitoring for Kubernetes Cluster and Grafana visualization](https://i.ytimg.com/vi/CmPdyvgmw-A/default.jpg) [ Kube 26 ] Prometheus monitoring for Kubernetes Cluster and Grafana visualization
[ Kube 26 ] Prometheus monitoring for Kubernetes Cluster and Grafana visualization How Prometheus Monitoring works | Prometheus Architecture explained
 Monitoring Kubernetes with Prometheus – Tom Wilkie
 Grafana Dashboard📊: Monitor CPU, Memory, Disk and Network Traffic Using Prometheus and Node Exporter
 Installing Prometheus on Ubuntu | Prometheus for beginners -2
 Prometheus SNMP_Exporter Tutorial
 GOTO 2019 • An Introduction to Systems & Service Monitoring with Prometheus • Julius Volz
 Introduction to Prometheus monitoring
 How to collect metrics and create dashboards using Grafana, Prometheus and AppMetrics in .NET Core