WEBINAR: Exploring Satellite Imagery and Extracting Analysis Using LANDVIEWER
This webinar provides an in-depth introduction to #LandViewer (https://eos.com/landviewer), the cloud-based service for search, exploring and on-the-fly analysis of #satelliteimagery.
04:04 — Demo #1: LandViewer toolset
04:28 – Working with Area of Interest (AOI)
06:18 – Search for imagery
09:37 – Setting up notifications about new scenes
11:23 – Managing your AOIs
13:00 – Band combinations and spectral indexes
13:17 – New spectral indexes: SAVI, ARVI, EVI, GCI, SIPI, NBR
16:38 – How to create a custom index/band combination
18:30 – Time Series analysis
22:37 — Building Time-lapse animations
25:35 – Contrast stretching
27:07 – WMS (Web Map Service)
28:39 – Downloading data
30:26 – Additional tools (ruler, layers of map, sharing, 3D visualization)
Demo #2: High resolution satellite data
37:25 – How to order a high resolution image
42:06 – Viewing and analysis of the purchased data
43:20 – Comparison slider: high resolution vs. medium resolution
47:00 – Q & A section
__________________________________________
Subscribe to our channel and follow us on social media to stay tuned for next webinars!
Facebook ➡️ https://www.facebook.com/eosda/
Twitter ➡️ https://twitter.com/eos_da
Linkedin ➡️ https://www.linkedin.com/company/10596231/
Instagram ➡️ https://www.instagram.com/eosda/
Medium ➡️ https://medium.com/@eos_da
Видео WEBINAR: Exploring Satellite Imagery and Extracting Analysis Using LANDVIEWER канала EOS Data Analytics
Показать
Комментарии отсутствуют
Информация о видео
Другие видео канала
 When deep learning meets satellite imagery
 2000 Pallets a Day? The Simplest Biz
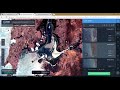 Land Viewer: Download Latest Satellite Imagery and Analysis Spectral Indices in your Browser
 Hands-on Satellite Imagery Analysis | Scipy 2019 Tutorial | Samapriya Roy, Sara Safavi
 How to Build a Radio Telescope (See Satellites 35,000km Away!)
 LEARN LAND VIEWER - Visualization
 How does Satellite Television work? | ICT #11
 Creating a Band Ratio Composite in QGIS 3.10 (Lab 2 - V3)
 Imagery in ArcGIS for Agriculture
 Descargar imágenes satelitales de Land Viewer
 How do Satellites work? | ICT #10
 Land Viewer
 How Computers See the Earth: A ML Approach to Understanding Satellite Imagery (Cloud Next '18)
 Neal Jean, " "Combining satellite imagery and machine learning to predict poverty"
 Spy Satellites - Imaging
 LEARN LAND VIEWER - Introduction & Basics
 Spectral analysis for geological applications
 Drone2Map: An Introduction
 Real-Time Machine Learning on Satellite Imagery: How DigitalGlobe Uses Amazon SageMaker
 Unsupervised Classification Using the SCP Plugin in QGIS 3.10