3. How & Why Do Support Resistances Form? TataSteel Case Study
Explains WHY support and resistances form, we show you the psychology behind it.
Visit: https://www.learnapp.co for more videos.
------------------------------------------------------------------
Video Transcript:
Hi I'm Prateek singh and today we are going to talk about support and resistance
Now there are a lot of resources available on the internet about support and resistances so I wont waste too much time explaining this. Today I'm going to teach you something more interesting,
I will explain how and why support resistances form. The psychology behind it,
here is a quick overview of resistance, it is basically the point where stocks rallied and then declined at a previously turn around area. Here is an example of resistance.
If you notice prices went up and then fell down creating point A, prices then carried on a small sideways move afterwhich they rose and touched Point A again, when prices come back to previously turn around areas that area usually has a lot of supply (hence prices reverse). The blue line is reisstance.
Here is another example of resistance, its almost the same except point 2 actually tried to break point 1, if you see that wick up there it closed below the blue line and then prices finally fell.
Generally when markets visit previous highs, that area is called resistance *as shown in chart*
Moving onto support, is just the opposite, its an area where markets fell down and then rallied. That reversal area is where demand came in and is called support.
*shows chart* Point 1 is where prices initially turned around, point 2 is where price visited the support area and bounced back up creating a hammer. The blue line is support.
Now let's come to something more interesting, how are prices reacting to levels where the stock previously turned around?
Lets take a case study example of tatasteel, this is a hypothetical example.
At any given time there are three market participants, the buyer, the seller and the person with no position and sits on the sidelines tracking every pulse of the market he is listening to news comparing notes; although this character is not a participants he may and most likely will participate in the future.
So let's see what these 3 people do when TataSteel rises
1) Tatasteel is trading at Rs 500 and the buyer has bought shares
2) The short seller has sold at Rs 500
3) non participants.
Now markets rise from Rs 500 to 510
The buyer although making money is wishing he had bought more shares
The seller is loosing Rs 10 per share and wants to cut his losses
The non participant wishes he had listened to his gut and bought at Rs 500 when he had the chance
Now here is a twist,
Prices from rs 510 come back down to rs 500
Now all three participants are ready to buy.
the buyer has his second opportunity buy more shares (although this is not recommended, one should not add to positions on a whim but in this example this is what the buyer does)
The short seller is now making a no profit no loss and covers his position ( buys)
The non participants, finally participates as he has an opportunity to buy.
support works, as demand comes in and markets go up. This is a general idea of how support and resistances work, this is also why trend lines work. When market reaches a tipping point in the absence of supply, markets go up. The same is true for a fall.
Видео 3. How & Why Do Support Resistances Form? TataSteel Case Study канала LearnApp
Показать
Комментарии отсутствуют
Информация о видео
Другие видео канала
 2. Can Stock Charts Predict The Future? Trading Systems
 How To Identify Powerful Support/Resistance - This Should Not Be FREE
 11.Ascending Triangle - Seeing Breakouts Before They Happen
 9. What Are Flags ? What To Do When Stocks Rise Quickly
 Support and Resistance Cheatsheet (95% Of Traders Don't Know This)
 4. How To Identify Stock Market Direction (Trends) Part 1
 Why Support and Resistance Works: The Psychology Explained ☝
 5. (Part2) How To Identify Stock Market Direction (Trends) Part 2
 6. Chart Patterns An Introduction
 How to Analyze Candlestick chart- 1 minute candlestick live trading
![Master The Support and Resistance Trading Strategy [ ALL YOU NEED TO KNOW ]](https://i.ytimg.com/vi/paLc9SArhk8/default.jpg) Master The Support and Resistance Trading Strategy [ ALL YOU NEED TO KNOW ]
Master The Support and Resistance Trading Strategy [ ALL YOU NEED TO KNOW ]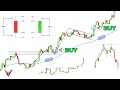 The Only Technical Analysis Video You Will Ever Need... (Full Course: Beginner To Advanced)
 Trading 101: How to Buy Stocks
 These DON'T Count as Support or Resistance Levels 🚫
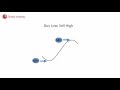 How to Figure out if a Stock is Worth Buying
 Why I Will Never Invest in Penny Stocks (3 Penny Stocks Myths BUSTED)
 LA Class - High Momentum Swing Strategy | Prateek Sharma
 Meet a Super Trader from Patna and learn the art of F&O Hedging
 What is Up Trend, Down Trend and Sideways Trend | Technical Analysis Ep2 By CA Rachana Ranade