2. Can Stock Charts Predict The Future? Trading Systems
Case Study: So can charts really predict the future?
Visit: https://www.learnapp.co
Or do we need other things to be profitable?
-------------------------------------------------------
Transcript:
Today we will be answering an interesting question, over the years I have been asked this question several times. How can you predict the future when the only thing you know is the past, can data predict the future (stock market). Can charts predict the future using technical analysis? I'm going to answer this question with a small case study, so we can understand this better.
Well first, the premise of the question is actually wrong, you don't need to predict the market in order to make profits, what you do need is a system which you have tested properly add a dash of money management and you have got a recipe to be a profitable trader.
Number two crowd psychologies, now every time you put on that trade be it a buy or be it a sell you are trading with another human being. Alan Greenspan once said "irrational exuberance" for a great bull market; this is also the reason why you see stocks plunge in one day, which we call a crash. This happens because people become greedy and scarred in an instant. Crowd [psychology plays a very important role and charts can imprint that.
number three, empirical data, traders use historical price as we say, over many years, they analyse it which we call quantitative analysis and try to find or decipher a commonly recurring pattern, this helps us identify something that keeps happening, add a way to manage risk and you are on your way to success.
Now the theory part of this is over.
Case study: Your trading system
Let's suppose you are great at trading the symmetrical triangle now for those people who don't know what a symmetrical triangle is it is basically price converging at the acentral point ther are grouped under continuation patterns and once you reach the end of the pattern; this is what it looks like it will generally break upwards (in an uptrend) or fall down (in a downtrend).
Now let's say you decide to make a system out of this, you need
1) Time frame (15min charts)
2) Method/setup (trade the symmetrical triangle)
3) Stock List (list of 5 stocks to trade)
Its impossible to trade all stocks on the nifty index (50 index) , so lets take 5 stocks which we trade everyday and trade this pattern. Reliance, reliance capital, GMR , LT Larsen and toubro and Nifty futures, so this is your stock list.
Backtesting
Now we will take these conditioned and run it though a test of 2-3 years and see what we get.
Let's suppose we see that :
70% of the time trades move 2% in your favour
Now this is a great find, all we need to do now is manage our risk and reward. The main thing in trading is not the method but money management. Preserving capital and managing risk is what we are doing to earn living trading stocks.
So 70% stocks move in your favour and 30% of the time they are against you.
so out of 10 trades, 7 trades are profits of 2% each
Therefore
7 profit * 2 = +14%
3 loss * 1 = -3%
Net gain 11%
We limited out losses to maximum of 1% per trade, this enabled us to get a great risk reward.
This is why you don't need to predict the market, you need to follow a system, that is tested thoroughly and manage your risk and make sure that your losses are smaller than your profits.
This is the holy grail,, this is the "magic indicator" this is the most important ingredient in the trading strategy cauldron.
Видео 2. Can Stock Charts Predict The Future? Trading Systems канала LearnApp
Показать
Комментарии отсутствуют
Информация о видео
Другие видео канала
 3. How & Why Do Support Resistances Form? TataSteel Case Study
 ❌ Stop using These Indicators Together | Biggest Trading Indicator Mistakes to Avoid
 LearnApp Talks: Trading Mistakes, Biggest Losses, Lessons, Mindset with Prateek Singh
 6. Chart Patterns An Introduction
 9. What Are Flags ? What To Do When Stocks Rise Quickly
 8. Symmetrical Triangles - How To Trade Them Profitably
 4. How To Identify Stock Market Direction (Trends) Part 1
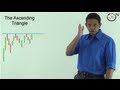 11.Ascending Triangle - Seeing Breakouts Before They Happen
 5. (Part2) How To Identify Stock Market Direction (Trends) Part 2
 The Top 5 Technical Indicators for Profitable Trading
 How to make a Premarket Watchlist? Create a Trading Plan for Day Trading Beginners (Part 1)
 🔍How to Analyze an IPO: A complete Guide | Top 5 Tips to Analyze an IPO the Best Way
 7. Symmetrical Triangles
 Candlestick Patterns Cheat Sheet (95% Of Traders Don't Know This)
 Why Support and Resistance Works: The Psychology Explained ☝
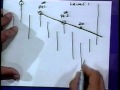 Tom DeMark: Using Trend Lines to Predict Stock Price
 Understanding Candlestick Charts for Beginners
 10 True Growth Stocks at a Reasonable Price (GARP) | FAST Graphs
 What is Candlestick Pattern? Nifty Chart Pattern Chai Pe Stock Market! Day 15 with CA Rachana Ranade