Best Triangle Patterns That WORK!! (MUST KNOW)
Intraday Trading Strategies for Forex and Stock Market The Best Triangle Patterns That Work so you can make money online as a Day Trader in Day Trading or as a Swing Trader in Swing Trading. Here's a How to Tutorial Guide on Ascending, Descending and Symmetrical Triangle Chart Patterns. Other knows words are Flag patterns, bull flag pattern.
If you want to make good money, Triangle patterns will help you do that very quickly. Triangle Chart patterns are one of the most useful chart patterns for day traders. Every intraday trader should be aware of these patterns, not only to make more money, But also to avoid taking trades in the wrong directions.
The following patterns are loved by day traders, because a triangle patterns shows decrease in volatility, and it helps to predict a better price direction. They also provide good trading opportunities, with good profit and loss ratio. If you are a day trader, you should be aware of these Triangle Chart patterns to make money in your trading career.
In this video, we are going to understand three main triangle chart patterns, and then, we will see a profitable strategy based around them. Before we start, make sure to Subscribe to this channel to see more free trading videos that will help you make money.
Number 1. The Ascending Triangle.
It is a triangle chart pattern that has relatively similar swing highs, but the swing low is rising towards the high. If you draw a trend line along the swing highs, the trend line will look like a horizontal line. But if you draw a trend line along the swing lows, the line will look like an uptrend. It will look like an ascending triangle. Swing high on this chart pattern will act as a strong resistance.
Number 2. The descending Triangle.
It is a triangle chart pattern that has relatively similar swing lows, but the swing high is falling towards the low. If you draw a trend line along the swing lows, the trend line will look like a horizontal line. But if you draw a trend line along the swing high, the line will look like a downtrend. It will look like a Descending triangle. Swing low on this chart pattern will act as a strong support.
Number 3. The Symmetrical Triangle.
It occurs when the price cannot make new higher highs, but is also struggling to make new lower lows. The result of this looks like a triangle, where price is brought to a narrow range. If you connect the swing highs using a trend line, you will see a downtrend. But if you connect the swing lows with a trend line, you will see an uptrend. Both trend lines intersect each other. Usually, price tends to gain a lot of momentum once it breaks through the pattern.
Now that we understand the three triangle patterns, lets see how to make money using this information.
The strategy of break-out can be used in every kind of triangle. The result is the same, irrespective of whether the triangle is, ascending, descending, or symmetrical.
When an asset price goes beyond the upper trend line of a triangle, Or when the price of an asset drops below the lower trend line of the triangle, The break-out strategy must be applied.
Since each trader will draw the trend lines very differently, the exact point of entry can vary between traders. To make sure you enter the trade at the right price, you can use volume changes that will illustrate when the price starts gaining momentum.
But if you are an experience trader, and want to get a bigger reward relative to your risk, you can use the Anticipation Strategy. Since we know that the price will breakout from the triangle, we can anticipate the breakout direction few minutes before the breakout. This will get us a better price, and will increase our potential profit.
But the skill to anticipate a breakout, you need to have a decent bit of experience in trading. So, if you are a beginner, you should wait for the breakout, and then and only then, you should enter a trade.
Once you have entered a trade, always use a stop loss. Even if the price moves to your advantage, it can always be reversed. The risk is controlled by a stop loss. You can always get out of a bad trade using a stop loss order, instead of losing a lot of money on it. There is always a better trade waiting for you.
With a stop loss, you can set a maximum amount you are willing to risk on a trade. You should never risk more than 1 to 2 percent of your total capital, on a single trade. Money management is the key to success in trading.
There are couple of ways to set a stop loss for these triangle chart patterns strategies. Once the breakout has occurred, you can set the stop loss below the candle that broke out. Another way is to set the stop loss, out of the triangle. This is more secure, but also reduces the risk to reward ratio. You should back test this strategy and use the stop loss that suits you.
Subscribe for more videos!
Видео Best Triangle Patterns That WORK!! (MUST KNOW) канала TRADING RUSH
Показать
Комментарии отсутствуют
Информация о видео
Другие видео канала
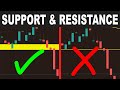 How to draw Support and Resistance like a PRO
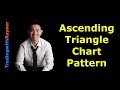 Ascending Triangle Chart Pattern (Trading Strategy)
 Symmetrical Triangle Stock Chart Pattern: Technical Analysis Ep 216
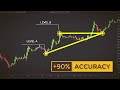 Trading With Ascending Triangles To Find Explosive Breakouts (Forex & Stock Trading Strategy)
 Oliver Velez | The Most Powerful Trading Tactic of All Time
 Best VWAP Indicator Trading Strategy EVER!!! How to use VWAP Indicator Intraday Trading Strategy
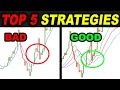 Top 5 BEST Trading Strategies that work with PROOF
 The Secret Code Of Successful MACD Trading (Forex & Stock Trading Strategies )
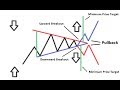 Turning Triangle Patterns Into Successful Trading
 VOLUME Trading to find the BIG and Smart Traders
 3 Simple Ways To Use Candlestick Patterns In Trading; SchoolOfTrade.com
 How to Grow a Small Trading Account FAST - Day Trading !!
 Live Trading Forex Strategy EVER!!! Made +175 $ in 4 MINUTES on Intraday Trade
 Simple Moving Average Crossover risked 100 TIMES to find the REAL WIN RATE ? SMA Trading Strategies
 How to Actually Trade with RSI: The real Way (Including MACD and Stochastic)
 5 Things To Look For Before You Place A Trade (Price Action Trading Strategy)
 Ichimoku Cloud Trading Strategy - How to use the Ichimoku Kinko Hyo Indicator
 BEST Risk to Reward Ratio for Day Trading Stocks and Forex?
 ADX Average Directional Movement Index DMI - Best Indicator for Forex and Stock Market?