- Популярные видео
- Авто
- Видео-блоги
- ДТП, аварии
- Для маленьких
- Еда, напитки
- Животные
- Закон и право
- Знаменитости
- Игры
- Искусство
- Комедии
- Красота, мода
- Кулинария, рецепты
- Люди
- Мото
- Музыка
- Мультфильмы
- Наука, технологии
- Новости
- Образование
- Политика
- Праздники
- Приколы
- Природа
- Происшествия
- Путешествия
- Развлечения
- Ржач
- Семья
- Сериалы
- Спорт
- Стиль жизни
- ТВ передачи
- Танцы
- Технологии
- Товары
- Ужасы
- Фильмы
- Шоу-бизнес
- Юмор
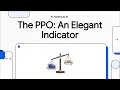
Parkinson Volatility: How to Measure Intraday Risk Correctly
The Parkinson Volatility Indicator solves a massive blind spot in how most traders measure market risk. If you are only looking at "Close-to-Close" data, you are missing 80% of the story.
Standard historical volatility measures risk from one day's closing price to the next. But this method completely ignores the intraday chaos—the highs, the lows, and the emotional swings that stop traders out.
In 1980, physicist Michael Parkinson introduced a better way. By utilizing the High and Low prices of the day, the Parkinson Volatility Estimator provides a much sharper lens on market behavior. It is statistically 5x more efficient than traditional methods, meaning you need significantly less data to get an accurate reading on asset risk.
In this deep dive, we explore the math behind the indicator, its massive advantages for crypto and growth stocks, and its one "Achilles Heel"—the overnight gap.
[Timestamps]
0:00 The Volatility Blind Spot
1:21 Why "Close-to-Close" Fails
1:51 The Parkinson Solution (High/Low)
2:37 The 5x Efficiency Edge
3:39 A Trader's Risk Toolkit
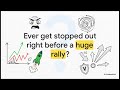
4:09 The Achilles Heel: Overnight Gaps
5:08 Choosing the Right Volatility Tool
[Discussion Question]
❓ When measuring risk, do you prefer a perfect model that requires years of data, or a highly efficient model that works with just 2 months of data? Let me know in the comments!
#ParkinsonVolatility #QuantitativeTrading #MarketRisk #TradingIndicators #FinancialMath #AlgorithmicTrading #VolatilityTrading #RiskManagement #StockMarketEducation #CryptoTrading
Видео Parkinson Volatility: How to Measure Intraday Risk Correctly канала WaveLabs
Standard historical volatility measures risk from one day's closing price to the next. But this method completely ignores the intraday chaos—the highs, the lows, and the emotional swings that stop traders out.
In 1980, physicist Michael Parkinson introduced a better way. By utilizing the High and Low prices of the day, the Parkinson Volatility Estimator provides a much sharper lens on market behavior. It is statistically 5x more efficient than traditional methods, meaning you need significantly less data to get an accurate reading on asset risk.
In this deep dive, we explore the math behind the indicator, its massive advantages for crypto and growth stocks, and its one "Achilles Heel"—the overnight gap.
[Timestamps]
0:00 The Volatility Blind Spot
1:21 Why "Close-to-Close" Fails
1:51 The Parkinson Solution (High/Low)
2:37 The 5x Efficiency Edge
3:39 A Trader's Risk Toolkit
4:09 The Achilles Heel: Overnight Gaps
5:08 Choosing the Right Volatility Tool
[Discussion Question]
❓ When measuring risk, do you prefer a perfect model that requires years of data, or a highly efficient model that works with just 2 months of data? Let me know in the comments!
#ParkinsonVolatility #QuantitativeTrading #MarketRisk #TradingIndicators #FinancialMath #AlgorithmicTrading #VolatilityTrading #RiskManagement #StockMarketEducation #CryptoTrading
Видео Parkinson Volatility: How to Measure Intraday Risk Correctly канала WaveLabs
Parkinson Volatility Indicator historical volatility calculation measuring market risk Garman Klass vs Parkinson Close to Close volatility quantitative finance intraday volatility trading volatility strategies volatility estimators python for finance Michael Parkinson physicist stock market math risk management for traders crypto volatility average true range alternative
Комментарии отсутствуют
Информация о видео
13 декабря 2025 г. 14:05:54
00:06:10
Другие видео канала