- Популярные видео
- Авто
- Видео-блоги
- ДТП, аварии
- Для маленьких
- Еда, напитки
- Животные
- Закон и право
- Знаменитости
- Игры
- Искусство
- Комедии
- Красота, мода
- Кулинария, рецепты
- Люди
- Мото
- Музыка
- Мультфильмы
- Наука, технологии
- Новости
- Образование
- Политика
- Праздники
- Приколы
- Природа
- Происшествия
- Путешествия
- Развлечения
- Ржач
- Семья
- Сериалы
- Спорт
- Стиль жизни
- ТВ передачи
- Танцы
- Технологии
- Товары
- Ужасы
- Фильмы
- Шоу-бизнес
- Юмор
Mean Reversion Strategy: Z-Score Setup
Retail traders fail to execute a Mean Reversion Strategy because they cannot distinguish between overbought conditions and a regime shift. This breakdown utilizes Z-scores and statistical deviation to quantify entry risk rather than relying on oscillators alone.
Key Takeaways
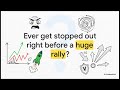
✅ Distinguish between tradable variance (rubber band) and structural trend breaks (random walk).
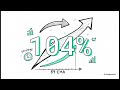
✅ Utilize Z-scores (4σ) to objectively identify statistical outliers beyond standard Bollinger Bands.
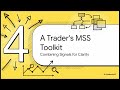
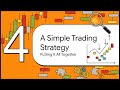
✅ Apply a 4-step execution framework to define "normal" vs. "extreme" price action.
Financial markets often display a tension between emotional momentum and arithmetic gravitation. While standard indicators like RSI suggest overbought/oversold conditions, they often fail during strong trending environments. Professional execution requires understanding the statistical probability of a return to the mean versus the probability of the Efficient Market Hypothesis (EMH) driving price discovery to a new level.
You’ll see why standard RSI signals fail between 03:41 and 04:13.
This analysis dissects the "Rubber Band" theory, contrasting behavioral finance arguments with the Random Walk theory, providing a balanced view for risk-managed entries.
Chapters
00:00 The Rubber Band Mechanism
00:54 Defining Historical Means
01:41 Measuring Deviation (Bollinger & RSI)
02:48 The 4-Step Execution Framework
03:19 Using Z-Scores for Outliers
03:40 The Random Walk Counter-Thesis
04:53 Regime Recognition: Reversion vs. Revolution
#MeanReversion #QuantitativeTrading #FinancialMarkets #ZScore #TradingStrategy
Видео Mean Reversion Strategy: Z-Score Setup канала WaveLabs
Key Takeaways
✅ Distinguish between tradable variance (rubber band) and structural trend breaks (random walk).
✅ Utilize Z-scores (4σ) to objectively identify statistical outliers beyond standard Bollinger Bands.
✅ Apply a 4-step execution framework to define "normal" vs. "extreme" price action.
Financial markets often display a tension between emotional momentum and arithmetic gravitation. While standard indicators like RSI suggest overbought/oversold conditions, they often fail during strong trending environments. Professional execution requires understanding the statistical probability of a return to the mean versus the probability of the Efficient Market Hypothesis (EMH) driving price discovery to a new level.
You’ll see why standard RSI signals fail between 03:41 and 04:13.
This analysis dissects the "Rubber Band" theory, contrasting behavioral finance arguments with the Random Walk theory, providing a balanced view for risk-managed entries.
Chapters
00:00 The Rubber Band Mechanism
00:54 Defining Historical Means
01:41 Measuring Deviation (Bollinger & RSI)
02:48 The 4-Step Execution Framework
03:19 Using Z-Scores for Outliers
03:40 The Random Walk Counter-Thesis
04:53 Regime Recognition: Reversion vs. Revolution
#MeanReversion #QuantitativeTrading #FinancialMarkets #ZScore #TradingStrategy
Видео Mean Reversion Strategy: Z-Score Setup канала WaveLabs
Комментарии отсутствуют
Информация о видео
24 января 2026 г. 16:02:43
00:06:10
Другие видео канала