Tsunami Forecast Model Animation: Alaska 1964
At 5:36 pm on Friday, March 27, 1964 (28 March, 03:36Z UTC) the largest earthquake ever measured in North America, and the second-largest recorded anywhere, struck 40 miles west of Valdez, Alaska in Prince William Sound with a moment magnitude we now know to be 9.2. Almost an hour and a half later the Honolulu Magnetic and Seismic Observatory (later renamed the Pacific Tsunami Warning Center, or PTWC) was able to issue its first “tidal wave advisory” that noted that a tsunami was possible and that it could arrive in the Hawaiian Islands five hours later. Upon learning of a tsunami observation in Kodiak Island, Alaska, an hour and a half later the Honolulu Observatory issued a formal “tidal wave/seismic sea-wave warning” cautioning that damage was possible in Hawaii and throughout the Pacific Ocean but that it was not possible to predict the intensity of the tsunami. The earthquake did in fact generate a tsunami that killed 124 people (106 in Alaska, 13 in California, and 5 in Oregon) and caused about $2.3 billion (2016 dollars) in property loss all along the Pacific coast of North America from Alaska to southern California and in Hawaii. The greatest wave heights were in Alaska at over 67 m or 220 ft. and waves almost 10 m or 32 ft high struck British Columbia, Canada. In the “lower 48” waves as high as 4.5 m or 15 ft. struck Washington, as high as 3.7 m or 12 ft. struck Oregon, and as high as 4.8 m or over 15 ft. struck California. Waves of similar size struck Hawaii at nearly 5 m or over 16 ft. high. Waves over 1 m or 3 ft. high also struck Mexico, Chile, and even New Zealand.
As part of its response to this event the United States government created a second tsunami warning facility in 1967 at the Palmer Observatory, Alaska--now called the National Tsunami Warning Center (NTWC, http://ntwc.arh.noaa.gov/ )--to help mitigate future tsunami threats to Alaska, Canada, and the U.S. Mainland.
Today, more than 50 years since the Great Alaska Earthquake, PTWC and NTWC issue tsunami warnings in minutes, not hours, after a major earthquake occurs, and will also forecast how large any resulting tsunami will be as it is still crossing the ocean. PTWC can also create an animation of a historical tsunami with the same tool that it uses to determine tsunami hazards in real time for any tsunami today: the Real-Time Forecasting of Tsunamis (RIFT) forecast model. The RIFT model takes earthquake information as input and calculates how the waves move through the world’s oceans, predicting their speed, wavelength, and amplitude. This animation shows these values through the simulated motion of the waves and as they travel through the world’s oceans one can also see the distance between successive wave crests (wavelength) as well as their height (half-amplitude) indicated by their color. More importantly, the model also shows what happens when these tsunami waves strike land, the very information that PTWC needs to issue tsunami hazard guidance for impacted coastlines. From the beginning the animation shows all coastlines covered by colored points. These are initially a blue color like the undisturbed ocean to indicate normal sea level, but as the tsunami waves reach them they will change color to represent the height of the waves coming ashore, and often these values are higher than they were in the deeper waters offshore. The color scheme is based on PTWC’s warning criteria, with blue-to-green representing no hazard (less than 30 cm or ~1 ft.), yellow-to-orange indicating low hazard with a stay-off-the-beach recommendation (30 to 100 cm or ~1 to 3 ft.), light red-to-bright red indicating significant hazard requiring evacuation (1 to 3 m or ~3 to 10 ft.), and dark red indicating a severe hazard possibly requiring a second-tier evacuation (greater than 3 m or ~10 ft.).
Toward the end of this simulated 24 hours of activity the wave animation will transition to the “energy map” of a mathematical surface representing the maximum rise in sea-level on the open ocean caused by the tsunami, a pattern that indicates that the kinetic energy of the tsunami was not distributed evenly across the oceans but instead forms a highly directional “beam” such that the tsunami was far more severe in the middle of the “beam” of energy than on its sides. This pattern also generally correlates to the coastal impacts; note how those coastlines directly in the “beam” are hit by larger waves than those to either side of it.
----------
Earthquake source used:
Johnson, J. M., K. Satake, S. R. Holdahl, and J. Sauber, The 1964 Prince William Sound earthquake: Joint inversion of tsunami and geodetic data, J. Geophys. Res., 101, 523–532, 1996
NOAA Science on s Sphere Version available at:
http://sos.noaa.gov/Datasets/dataset.php?id=605
Видео Tsunami Forecast Model Animation: Alaska 1964 канала PacificTWC
Показать
Комментарии отсутствуют
Информация о видео
Другие видео канала
 Kīlauea Volcano’s Earthquakes and Eruptions: April - August, 2018
 The 27 February 2010 Maule, Chile Earthquake and its Aftershocks
 Puerto Rico Earthquake Sequence: December 2019 - January 2020
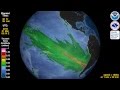 Tsunami Animation: Maule, Chile 2010 (rotating globe)
 Earthquakes of Alaska: 1918 - 2019
 Tsunami Animation: Three Tsunamis From Chile
 Tsunami Forecast Model Animation: Three Tsunamis in One Day From the Tonga-Kermadec Subduction Zone
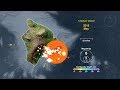 Earthquakes of Hawaiʻi Island: 2013 - 2018
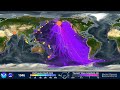 120 Years of Earthquakes and Their Tsunamis: 1901-2020
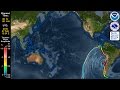 Tsunami Forecast Model Animation: Chile 2010
 Five Years of Earthquakes in Chile
 A Decade of Great Earthquakes
 Tsunami Animation: Tohoku, Japan 2011 (rotating globe)
 Earthquakes of the 20th Century
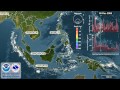 Nine Years of Earthquakes in Southeast Asia
 30 Years of Earthquakes in Japan: 1990 - 2019
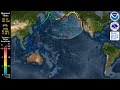 Tsunami Forecast Model Animation: Aleutian Islands 1946
 Tsunami Animation: Prince William Sound, Alaska, 1964 (virtual globe)
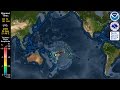 Tsunami Forecast Model Animation: Samoa 2009
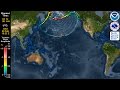 Tsunami Forecast Model Animation: Aleutian Islands 1957
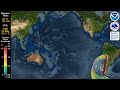 Tsunami Forecast Model Animation: Chile 1960