How to Make a Clustered Stacked and Multiple Unstacked Chart in Excel
View the Step-by-Step tutorial here:
https://www.exceldashboardtemplates.com/ClusteredStackedAndMultipleUnstackedChart
Quickly learn the tricks to make an Excel Clustered Stacked and Multiple Unstacked Chart.
Switch Rows/Columns Article Mentioned in the Video:
https://www.exceldashboardtemplates.com/SwitchRowsColumns
Видео How to Make a Clustered Stacked and Multiple Unstacked Chart in Excel канала Excel Dashboard Templates
Показать
Комментарии отсутствуют
Информация о видео
8 января 2020 г. 20:00:03
00:09:17
Другие видео канала
 How-to Create a Stacked and Unstacked Column Chart in Excel
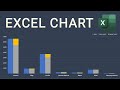 Excel Visualization | How To Combine Clustered and Stacked Bar Charts
 Clustered Stacked Bar Chart In Excel
 Stacked & Clustered - 1091 - Learn Excel Podcast
 How To Create A Clustered Stacked Column Chart In Excel
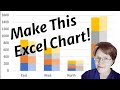 Make a Clustered Stacked Chart in Excel
 I asked 6 Excel experts to share their *BEST* tips & tricks 👌
 Combination Stacked & Clustered Column Chart in Excel - 2 Examples
 How To Create A Clustered Stacked Column Chart In Excel
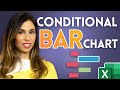 Simple Excel Trick to Conditionally Format Your Bar Charts
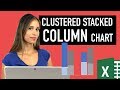 Excel Column Chart - Stacked and Clustered combination graph
 HOW TO CREATE A COMBINED CLUSTERED AND STACKED CHART IN EXCEL
 📊📈 How to make a combined bar and line graph in Excel (Combo chart) in 3 minutes
 TECH-005 - Create a quick and simple Time Line (Gantt Chart) in Excel
 How-to Easily Create a Clustered Stacked Column Chart in Excel
 How to Prepare an Overlapping Bar chart in Excel
 Add Total Values for Stacked Charts in Excel: Column & Bar Charts
 How to Add Error Bars of Standard Deviation in Excel Graphs (Column or Bar Graph)
 Timeline visuals in Power BI