Comparative Sales Analysis Dashboard in MS Excel & Power Pivot #salesdashboard #comparativeanalysis
Comparative Sales Analysis Dashboard in MS Excel & Power Pivot
In this video, I will walk you through the steps to undestand the Comparative Sales Analysis Dashboard in Micorosft Excel and Power Pivot. This Sales Vs. Target Dashbaord is interactive and provides insights to take business decisions.
You can download the Comparative Sales Analysis Dashboard from the below link.
https://thedatalabs.org/comparative-sales-analysis-dashboard/
If you are looking for Tempates and Trackers then follow the below link to download it from our website.
https://thedatalabs.org/category/templates-trackers/
#thedatalabs #Dashboard
Thanks for watching! Please like, share, comment and subscribe. Have a great day!
Видео Comparative Sales Analysis Dashboard in MS Excel & Power Pivot #salesdashboard #comparativeanalysis канала TheDataLabs
Показать
Комментарии отсутствуют
Информация о видео
Другие видео канала
 Beautiful Progressive Doughnut Chart with Dynamic Target Line in Excel (Step by Step Tutorial)
 Excel Trick 20 - Summarize and Consolidate Data from Multiple Sheets into One #shorts #exceltips
 Traffic Light Indicator on Map in Power BI
 How to add a Dynamic & Interactvie Pop-up Calendar in MS Excel (Step-by-Step Tutorial)
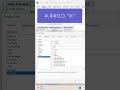 Excel Trick 7 - Custom Format to Display Numbers in Thousand (K) and Million (M) #shorts
 Excel Trick 5 - Unleash the Power of Unique Function in MS Excel #shorts
 How to Calculate a person's age in Excel
 How to create Funnel Chart in Excel
 Dynamic 3D Glass Fill Infographics in Excel - Simple Steps
 Excel Trick 16 - Transform Codes or Values into Barcodes with Ease! #shorts
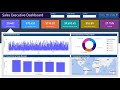 Sales Dashboard In Power BI (Interactive and Dynamic) - Demo
 Excel Trick 30 - Quick Analysis to calculate Running Total and % Total #shorts
 Complaint Management System in Excel and VBA - Part 4 (Creating Resolve Complaint UserForm)
 Excel Trick 42 - Get LIVE Stock Data in MS Excel Using Stocks Datatype #shorts
 How to make an organizational chart in Excel (Quick and Easy Steps updated)
 Develop Real-time Currency Converter Project in Excel #shorts
 Excel Trick 22 - Generate QR Code Easily in MS Excel #shorts
 Excel Trick 31 - Create Gantt Chart in MS Excel Quickly #shorts
 Excel Trick 13 - Hide Blank or Unwanted Cells in Seconds with Excel Keyboard Magic! #shorts
 Excel Trick 25 - How To Get Sum Total Quickly in MS Excel? #shorts