Multiple Regression in Excel - P-Value; R-Square; Beta Weight; ANOVA table (Part 3 of 3)
Check out our new Excel Data Analysis text:
https://www.amazon.com/dp/B076FNTZCV
This video illustrates how to perform a multiple regression statistical analysis in Microsoft Excel using the Data Analysis Toolpak.
Multiple Regression
Regression
R-Squared
ANOVA table
Regression Weight
Beta Weight
Predicted Value
YouTube Channel (Quantitative Specialists): https://www.youtube.com/user/statisticsinstructor
Subscribe today!
Video Transcript: and if you recall, if we use an alpha .05, which is what we typically use and we'll also use in this example. If this p-value is less than .05, then that indicates the test is significant. So this value is significant because .0004 is definitely less than .05. So this indicates that the R-squared of .50 is significantly greater than zero. So in other words, the variables SAT score, social support, and gender, once again taken as a group, predict a significant amount of variance in college GPA. And we could write that up as follows. We could say the overall regression model was significant, and then we have F 3, 26 and that comes from right here, 3 and 26, = 8.51, which is the F value here reported in the table, p is less than .001, and I said that because this value is smaller than .001. And I also put the R-squared here. R-squared = .50, and that of course came from right here. So you'll often see results written up like this, in a research article or what have you. So this is one way to express the results of the ANOVA table. So if you're reading a research article on multiple regression and you see this information here, most likely, this first part here is corresponding to the results of the ANOVA table. OK so these first two tables, as I had said earlier, they assess how well our three predictors, taken as a set, did at predicting first-year college GPA. Moving to our last table, this is where we look at the individual predictors. Whether SAT score, on its own, social support, on its own, and gender, once again on its own, are these three variables significant predictors of college GPA. Now it may be that one of them is significant, two of them are, or all three of them are significant, but that's what this table assesses. So as we did before, we'll use alpha .05, once again. So we're going to assess each of these values against .05. And notice that SAT score, this p-value definitely is less than .05, so SAT is significant. Social support, this p-value, while fairly close, is also less than .05, so social support is significant as well. But notice gender, .66, that's definitely not less than .05, so gender is not significant. And that's really not that surprising because males and females don't typically differ significantly in their college GPA, in their first year, or in all four years for that matter. But I wanted to include this variable gender in this model as well, so you can see an example of a non-significant result. So once again this table is looking at the predictors individually, so this indicates here that SAT score is a significant predictor of college GPA, social support is also a significant predictor of college GPA, but gender is not a significant predictor. Now in this table here what we're assessing is whether these predictors account for a significant amount of unique variance in college GPA. So in other words what that means is that SAT scores significantly predicts college GPA, so it accounts for a separate, significant part of college GPA than social support, which is also significant, but it accounts for a unique part of college GPA that SAT does not account for. So if a test is significant here, that means that the variable accounts for a significant amount of variance in college GPA uniquely to itself. And that's an important point to note here, and that's frequently confused with multiple regression. So, a scenario, if these two predictors were completely and perfectly correlated at 1.0, in other words they're really getting at the exact same thing in college GPA, then neither of these would be significant if that was the case, because neither of them would be accounting for any unique information in college GPA whatsoever. They would be totally redundant and they would both not be significant. So if a predictor is significant here, as these both are, then that tells us that they account for a significant amount of unique variance in college GPA. So to wrap it all up here, to summarize, our regression overall was significant as we see that in the ANOVA table, and the amount of variance that was accounted for, when the three predictors were taken as a group, was 50% of the variance, or half of the variance, which was pretty good. When we looked at the predictors individually, SAT score was a significant predictor of college GPA, as was social support, but gender was not significant. This concludes the video on multiple regression in Microsoft Excel. Thanks for watching.
Видео Multiple Regression in Excel - P-Value; R-Square; Beta Weight; ANOVA table (Part 3 of 3) канала Quantitative Specialists
Показать
Комментарии отсутствуют
Информация о видео
7 октября 2014 г. 20:00:02
00:05:39
Другие видео канала
 Multiple Regression in Excel
 p-values: What they are and how to interpret them
 Logistic Regression Details Pt 3: R-squared and p-value
 Understanding the p-value - Statistics Help
 Tutorial 32- All About P Value,T test,Chi Square Test, Anova Test and When to Use What?
 Multiple Regression in SPSS - R Square; P-Value; ANOVA F; Beta (Part 3 of 3)
 Adjusted R squared vs. R Squared For Beginners | By Dr. Ry @Stemplicity
 StatQuest: P Values, clearly explained
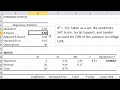 Multiple Regression in Excel - P-Value; R-Square; Beta Weight; ANOVA table (Part 2 of 3)
 Correlation & Regression: Concepts with Illustrative examples
 Multiple Regression in Excel - P-Value; R-Square; Beta Weight; ANOVA table (Part 1 of 3)
 Using a P-value to make conclusions in a test about slope | AP Statistics | Khan Academy
 How to Calculate a Correlation (and P-Value) in Microsoft Excel
 Excel Regression Output - How You Can Quickly Read and Understand It
 Correlation and Multiple Regression in Excel
 Multiple Regression - Interpretation (3of3)
 What is R-Squared
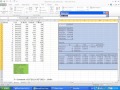 Using Multiple Regression in Excel for Predictive Analysis
 StatQuest: R-squared explained