Statistics with R: How to convert a continuous variable to a factor (categorical variable) part 1
A point I didn't make clear in the video. When getting the cut-off points using quantile(), the 1st lower boundary value should be set lower than the minimum value of the continuous variable, whether or not the min value is 0. In this example the min is 0, so I set the 1st lower bound in cut() to -1.
Видео Statistics with R: How to convert a continuous variable to a factor (categorical variable) part 1 канала Phil Chan
Видео Statistics with R: How to convert a continuous variable to a factor (categorical variable) part 1 канала Phil Chan
Показать
Комментарии отсутствуют
Информация о видео
Другие видео канала
 #3 Exercises in regression: OLS in simple linear regression
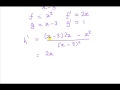 Quotient rule for differentiation
 Multiplying powers of powers - gentle introduction with examples part 2 of 3
 #12 Venn diagram and sets notation
 Variance formula for random variable
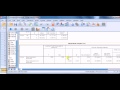 SPSS for newbies: independent samples t-test as a regression
 ST102 notes: Relationship between the t - distribution with normal and chi-square | 2 of 2
 Inadequacy of scatterplots Y vs Xs in mulitple regression
 Differentiation: how to use the product rule part 1 of 2
 #77 P(X=a)=0 for continuous random variables proof
 SPSS for newbies: Basic data transformation, and data management
 Percentage point Z table | 1 of 3
 #10 Exercises in regression: computing the standard error of the regression
 #65 Law of Total Probability example
 Ask Phil SPSS: measurement box in Variable View
 Eviews 7: Interpreting the coefficients (parameters) of a log-lin model
 Z-score and standardization | what and why? |part 1
 Differentiation rules for exponential and log functions part 1 of 2
 Top 5 mistakes students make in probability
 Biostatistics R: Preparing for analysis hmohiv.dat in Hosmer and Lemeshow
 Counting example in probability part 1 - fundamental theorem of counting