Eviews 7: Interpreting the coefficients (parameters) of a log-lin model
Subject: Econometrics
Level: Newbie
Topic: Functional form; semilogarithmic regression; interpreting the coefficient where the dependent variable is not transformed, and the explanatory variable (X) is logged.
Видео Eviews 7: Interpreting the coefficients (parameters) of a log-lin model канала Phil Chan
Level: Newbie
Topic: Functional form; semilogarithmic regression; interpreting the coefficient where the dependent variable is not transformed, and the explanatory variable (X) is logged.
Видео Eviews 7: Interpreting the coefficients (parameters) of a log-lin model канала Phil Chan
Показать
Комментарии отсутствуют
Информация о видео
Другие видео канала
 #3 Exercises in regression: OLS in simple linear regression
 Quotient rule for differentiation
 #12 Venn diagram and sets notation
 Variance formula for random variable
 SPSS for newbies: independent samples t-test as a regression
 ST102 notes: Relationship between the t - distribution with normal and chi-square | 2 of 2
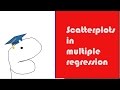 Inadequacy of scatterplots Y vs Xs in mulitple regression
 #77 P(X=a)=0 for continuous random variables proof
 SPSS for newbies: Basic data transformation, and data management
 Percentage point Z table | 1 of 3
 #10 Exercises in regression: computing the standard error of the regression
 #65 Law of Total Probability example
 Ask Phil SPSS: measurement box in Variable View
 Z-score and standardization | what and why? |part 1
 Top 5 mistakes students make in probability
 Biostatistics R: Preparing for analysis hmohiv.dat in Hosmer and Lemeshow
 Counting example in probability part 1 - fundamental theorem of counting
 Introduction to statistics for newbies
 Ask Phil SPSS: Selecting cases in SPSS
 Ask Phil SPSS: adding ilikert scales to create a total score for regression