Visualizing Absolute Max/Min of Multivariable Function on a region with GeoGebra 3D
Solving one of these by hand: https://youtu.be/ix0EqLRpdBU
In this video we use GeoGebra 3D to visualize the part of a surface above or below a given region in the xy-plane so we can see what we're doing when we solve optimization problems for multivariable functions. We use a lot of features: graphing 3d functions, graphing planes, finding traces of a surface in a plane using the curve command, and graphing only part of a surface using an if command with conditions determined by the constraints. You definitely need to know that && is how we do an "and" for the constraints in the if command.
This is a great way to look at these sorts of problems in multivariable calculus.
Видео Visualizing Absolute Max/Min of Multivariable Function on a region with GeoGebra 3D канала turksvids
Показать
Комментарии отсутствуют
Информация о видео
Другие видео канала
 Exploring Partial Derivatives in GeoGebra 3D
 Convert Curve surface of a cylinder into rectangular plane
 Mathematical Modeling with Geogebra
 Graphing System of Linear Inequalities in GeoGebra
 How to Create 3D Math Art on GeoGebra 1: Introduction - Step by Step Guide
 Modelling with Geogebra
 How to Create a Surface of Revolution (by Spinning any CURVE about any LINE) in GeoGebra 3D
 C2 M3: Drawing Bezier Curves with GeoGebra
 Introduction to GeoGebra
 How to Use the SURFACE Command to Create Surfaces in GeoGebra 3D
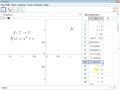 Drawing the Mandlebrot Set with GeoGebra - part 1
 HƯỚNG DẪN GEOGEBRA 3D
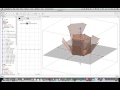 Creating an Animated Net in Geogebra
 Using GeoGebra 3D to look at Curves, Tangent Vectors, and Tangent Lines in 3D
 The properties of a quadratic function using GeoGebra
 Introduction to 3D GeoGebra-Volume of Prism
 Graphing Spherical Coordinates in GeoGebra 3D (Part 1): A Sphere
 Konturplot og niveaukurver i Geogebra
 Graphing Absolute Value Equations in GeoGebra.webm