Visualize Data Better in Business Slides | Excel & PowerPoint Tutorial
Find PowerPoint slide makeover examples to visualize data better in business slides.
We can use either Excel or PowerPoint to do this makeover. You will find 2 ideas to convert a slide with financial data into visual and engaging slides.
The step by step process to create these visuals in Excel and PowerPoint are shared in the video
1) Method 1 with Excel: A waterfall chart created in Excel to present the financial data.
* How to transfer this chart to PowerPoint to present the information.
* How to link the chart to Excel, so that it stays updated.
* How to increase the font size and make the chart suitable for presenting
2) Method 2 with PowerPoint: A stacked Bar Chart with animation in PowerPoint
* How to modify the chart to a Combo Chart to present Gross Margin in the background and the other expenses as parts of the margin.
* How to add Series Name, increase the font size and change colors of the chart
* How to add animations to the data chart by element in series
==========================
Link to get Microsoft Office 365:
==========================
https://microsoft.msafflnk.net/c/1877507/587660/7805
Disclosure: The above link is an affiliate link, meaning, at no additional cost to you, I will earn a commission if you click through and make a purchase.
==========================
Comprehensive All In One Bundle PowerPoint Templates: (Eligible for free upgrade to version 2.0)
==========================
https://shop.presentation-process.com/p/comprehensive-all-in-one-powerpoint-bundle-2-0
#ramgopalexcel
#ramgopalppt
The video is created in PowerPoint on Office 365 by Ramgopal.
=========
Slide Source:
=========
https://www.slideshare.net/MarketingAndSalesSummit/the-business-of-software-distribution-and-system-integration?qid=07301a88-c0b8-4319-ad7d-d5ebd6508b92&v=&b=&from_search=24
Видео Visualize Data Better in Business Slides | Excel & PowerPoint Tutorial канала Presentation Process
Показать
Комментарии отсутствуют
Информация о видео
Другие видео канала
 AWESOME PowerPoint DASHBOARD DESIGN | Step-by-Step TUTORIAL
 Which is the best chart: Selecting among 14 types of charts Part I
 Presenting Financials with PowerPoint
 30 Ultimate PowerPoint Tips and Tricks for 2020
 Introduction to Pivot Tables, Charts, and Dashboards in Excel (Part 1)
 Making a Great Financial Presentation
 Excel to PowerPoint - What's the best way to do it? (Embedding, Linking or Other)
 5 QUICK Ways to Improve Your PowerPoint Design
 Build Impressive Charts: It's NOT your usual Bar Chart (Infographics in Excel)
 MANAGEMENT CONSULTING PRESENTATION - How consulting firms create slide presentations (from McKinsey)
 Pivot Table and Slicer in PowerPoint… Are You Serious?
 PowerPoint Slide Design from Beginner to EXPERT in One Video 🔥100K Special🔥
 Five Data Storytelling Tips to Improve Your Charts and Graphs
 PROPERLY Share Your Screen in a Microsoft Teams Meeting (For BEST Experience!)
 Slicers in Excel Pivot Table
 31 Creative Presentation Ideas to Delight Your Audience
 9 Useful Time-Saving PowerPoint Tricks (for Beginners)
 Present with CONFIDENCE with THESE 3 PowerPoint Tips
 Do you know these 5 PowerPoint Hacks?
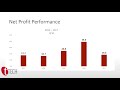 AGM 2018, Financial Performance Presentation by Finance & Admin. Manager, Hortense Gregory Nelson