- Популярные видео
- Авто
- Видео-блоги
- ДТП, аварии
- Для маленьких
- Еда, напитки
- Животные
- Закон и право
- Знаменитости
- Игры
- Искусство
- Комедии
- Красота, мода
- Кулинария, рецепты
- Люди
- Мото
- Музыка
- Мультфильмы
- Наука, технологии
- Новости
- Образование
- Политика
- Праздники
- Приколы
- Природа
- Происшествия
- Путешествия
- Развлечения
- Ржач
- Семья
- Сериалы
- Спорт
- Стиль жизни
- ТВ передачи
- Танцы
- Технологии
- Товары
- Ужасы
- Фильмы
- Шоу-бизнес
- Юмор
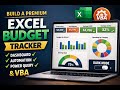
Excel KPI Dashboard for Small Business (Part 1) | Targets & RAG Status Step-by-Step
Most small businesses track data — but very few track the right KPIs.
In Part 1 of this Excel KPI Dashboard series, you’ll learn how to build a professional KPI dashboard for a small business, starting from raw data and ending with targets and Red-Amber-Green (RAG) status.
This video is beginner-friendly, interview-relevant, and focused on real business thinking, not just formulas.
🔹 What you’ll learn in Part 1:
How to structure sales, expenses, and inventory data
How to calculate key business KPIs in Excel
How to set KPI targets
How to apply RAG (Red-Amber-Green) logic
How to design a clean, executive-style dashboard layout
📌 Part 2 (Coming Next):
We’ll conclude the course by building Pivot Tables, Pivot Charts, and interactive Slicers to make the dashboard fully dynamic.
⏱ Timestamps
00:00 Intro
01:11 Data setup
03:00 KPI Calculations
04:12 Targets and RAG Status
05:22 RAG Logic
06:53 Dashboard Design
📂 Download the Excel File
👉 https://docs.google.com/spreadsheets/d/14ERDdmAFGZ1WLjumXP3gR6Ivfgf2TP5a/edit?usp=sharing&ouid=115993258064043523831&rtpof=true&sd=true
💡 Who this video is for:
Excel beginners
Data analysts
Small business owners
Job seekers preparing for Excel interviews
Anyone learning dashboards before Power BI
If you found this helpful, like, subscribe, and watch Part 2 to complete the dashboard with Pivot Tables and Slicers.
#ExcelDashboard
#KPIsInExcel
#SmallBusinessExcel
#ExcelTutorial
#ExcelForBeginners
#DataAnalytics
#BusinessDashboard
#RAGStatus
#ExcelKPIs
#PivotTables
#LearnExcel
#ExcelTips
Видео Excel KPI Dashboard for Small Business (Part 1) | Targets & RAG Status Step-by-Step канала The Data Doughnut
Комментарии отсутствуют
Информация о видео
11 января 2026 г. 4:00:06
00:09:57
Другие видео канала