Tsunami Animation: Sumatra, 2004
The magnitude 9.1 Great Sumatra-Andaman Earthquake of December 26, 2004, spawned the deadliest tsunami in history, killing more than 230,000 people in 14 countries around the Indian Ocean. More than half of those killed had lived in Acheh Province, Sumatra, where the tsunami rose as high as 30 m (100 ft.) and traveled more than 4 km (2.5 mi.) inland in this low-lying region.
This earthquake began at its epicenter near northern Sumatra and moved the earth's crust an average of 15 m (50 ft.) as it ruptured northward for at least 1200 km (750 mi.), almost to the coast of Myanmar (Burma), over an 8-minute period. This distance is at least 200 km (125 mi.) longer than the length of fault that moved during the largest earthquake ever recorded, the magnitude 9.5 Great Chile Earthquake of 1960.
This animation shows why this south-to-north rupture is important for understanding the behavior of this tsunami, and why such "progressive" rupture needs to be considered for future tsunami forecasting. If the earthquake had moved the fault along its entire length all-at-once it would have sent the largest tsunami waves perpendicular to the fault and so they would have passed south of Sri Lanka. The earthquake motion, however, started in the south and moved northward along the fault so the tsunami began radiating from near Sumatra before it could be generated near Myanmar, thus causing the largest tsunami waves to move in a different direction such that they strike Sri Lanka and Somalia directly, consistent with the tsunami waves actually observed in those countries.
PTWC created this animation using the progressive rupture described by Chlieh et al. (2007) as input for their experimental forecast model, RIFT (Wang et al., 2012). For the first 30 minutes of simulated time the animation is centered over the northern Indian Ocean and moves at 30x normal speed to show the details of the tsunami as generated by this progressive rupture. The animation then speeds up to 1800x normal speed (1 sec. = 30 minutes simulated time) to carry the simulation forward a full 24 hours while it also zooms out and rotates the virtual globe to show the entire Indian Ocean. The waves then fade to an "energy map" showing the maximum calculated tsunami heights on the open ocean, then fade again to a map of the maximum calculated tsunami heights on the impacted coastlines.
References:
Chlieh, M., Avouac, J., Hjorleifsdottir, V., Song, T.A., Ji, C., Sieh, K., Sladen, A., Hebert, H., Prawirodirdjo, L., Bock., Y., & Galetzka, J. (2007) "Coseismic Slip and Afterslip of the Great Mw 9.15 Sumatra--Andaman Earthquake of 2004." Bulletin of the Seismological Society of America, 97 (1A), S152--S173, DOI: 10.1785/0120050631
Wang, D., N.C. Becker, D. Walsh, G.J. Fryer, S.A. Weinstein, C.S. McCreery, V. Sardiña, V. Hsu, B.F. Hirshorn, G.P. Hayes, Z. Duputel, L. Rivera, H. Kanamori, K.K. Koyanagi, and B. Shiro (2012) "Real-time Forecasting of the April 11, 2012 Sumatra Tsunami" Geophysical Research Letters, 39, 6 pp., DOI: 10.1029/2012GL053081
Видео Tsunami Animation: Sumatra, 2004 канала PacificTWC
Показать
Комментарии отсутствуют
Информация о видео
Другие видео канала
 Kīlauea Volcano’s Earthquakes and Eruptions: April - August, 2018
 The 27 February 2010 Maule, Chile Earthquake and its Aftershocks
 Puerto Rico Earthquake Sequence: December 2019 - January 2020
 Tsunami Forecast Model Animation: Three Tsunamis in One Day From the Tonga-Kermadec Subduction Zone
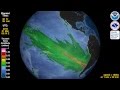 Tsunami Animation: Maule, Chile 2010 (rotating globe)
 Earthquakes of Alaska: 1918 - 2019
 Tsunami Animation: Three Tsunamis From Chile
 Earthquakes of Hawaiʻi Island: 2013 - 2018
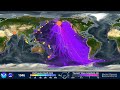 120 Years of Earthquakes and Their Tsunamis: 1901-2020
 Tsunami Forecast Model Animation: Chile 2010
 Five Years of Earthquakes in Chile
 A Decade of Great Earthquakes
 Earthquakes of the 20th Century
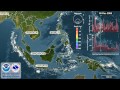 Nine Years of Earthquakes in Southeast Asia
 30 Years of Earthquakes in Japan: 1990 - 2019
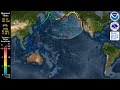 Tsunami Forecast Model Animation: Aleutian Islands 1946
 Tsunami Animation: Prince William Sound, Alaska, 1964 (virtual globe)
 Tsunami Animation: Tohoku, Japan 2011 (rotating globe)
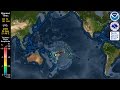 Tsunami Forecast Model Animation: Samoa 2009
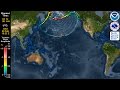 Tsunami Forecast Model Animation: Aleutian Islands 1957
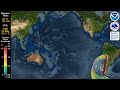 Tsunami Forecast Model Animation: Chile 1960