Python 🐍 Nonlinear Regression Curve Fit
The Scipy curve_fit function determines four unknown coefficients to minimize the difference between predicted and measured heart rate. Pandas is used to import and view the data. A Matplotlib plot is used to see how the initial guess values and the final optimized parameter values compare for generating predictions. An R-squared value is calculated to show how well the predictions and measurements align.
Course Material: https://apmonitor.com/che263/index.php/Main/PythonSolveEquations
Github Repository (see HW04.ipynb): https://github.com/APMonitor/learn_python
Schedule: https://apmonitor.com/che263/index.php/Main/CourseSchedule
Solution Videos: https://apmonitor.com/che263/index.php/Main/CourseHomework
Видео Python 🐍 Nonlinear Regression Curve Fit канала APMonitor.com
Показать
Комментарии отсутствуют
Информация о видео
Другие видео канала
 How to: Import, Plot, Fit, and Integrate Data in Python
 Statistics 101: Nonlinear Regression, The Very Basics
 How to fit non-linear equations in excel using solver
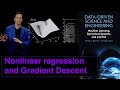 Nonlinear Regression and Gradient Descent
 Nonlinear Model Fitting using Excel
 Non-Linear CURVE FITTING using PYTHON
 Get started with using TensorFlow to solve for regression problems (Coding TensorFlow)
 How to use SciPy to curve fit in Python || Python for Engineers
 Interpreting Linear Regression Results
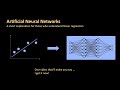 153 - Artificial Neural Networks - Explanation for those who understand linear regression
 How to Generate an Analytics Report (pdf) in Python!
 What is Pandas? Why and How to Use Pandas in Python
 Attacking Clustered Data with a Mixed Effects Random Forests Model in Python - Sourav Dey
 REGRESSION: Non-Linear relationships & Logarithms
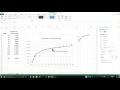 Nonlinear Regression Using Excel
 Python Videos 10a: Parameter Estimation with Python
 How to calculate linear regression using least square method
 Python 🐍 Curve Fit with Step Test Data
 Understanding Regression - Mean Squared Error / Loss