Python 🐍 Curve Fit with Step Test Data
The Scipy curve_fit function determines two unknown coefficients (dead-time and time constant) to minimize the difference between predicted and measured response values. Pandas imports the data and the dataframe header is diplayed with x.head(). Conditional statements are used to create a step function and curve_fit from Scipy.optimize finds the optimal parameter values that minimize a sum of squared error. A Matplotlib plot shows the function with optimal parameter values. An R-squared value is 0.999, showing excellent agreement between the predictions and measurements.
Course Material: https://apmonitor.com/che263/index.php/Main/PythonSolveEquations
Github Repository (see HW04.ipynb): https://github.com/APMonitor/learn_python
Schedule: https://apmonitor.com/che263/index.php/Main/CourseSchedule
Solution Videos: https://apmonitor.com/che263/index.php/Main/CourseHomework
Видео Python 🐍 Curve Fit with Step Test Data канала APMonitor.com
Показать
Комментарии отсутствуют
Информация о видео
Другие видео канала
 Python OpenCV Introduction
 Python Database for Data-Driven Engineering
 TCLab: Radiative Heat Transfer
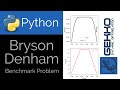 Bryson Denham Optimal Control
 Slurry Pipeline Design
 ML/DO 3: Moving Horizon Estimation
 Drone Flight Optimization
 AIChE Academy: Process Dynamics and Control
 Feature Engineering
 TCLab: PI Control Automation
 Industry 4.0 Lab
 Molecular Level Decisions for Design and Optimisation, Claire Adjiman
 Data Science 🐍 Interpolation
 Economic Model Predictive Control
 Minimize Fuel with ODE Optimization
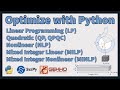 Optimize with Python
 Data-Driven Engineering Course Introduction
 Data Visualization in Python
 Regulate Blood Glucose with PID Control
 Data Cleansing
 Convolutional Neural Network Image Classification